How we used OpenTelemetry to fix a bug in OpenTelemetry
OpenTelemetry is here to help us find the root cause of issues in our software quickly. We recently had an issue that we were able to fix by using one feature of OpenTelemetry to identify the root cause of bug in another feature.
In this blog post, we want to share this interesting experience with you. By that, you will learn that minor differences in the language-specific implementations can have interesting implications and that you have a feature for Java and Python, which is here to help you to debug context propagation issues.
The issue
Describe the bug
For the blog post Learn how to instrument NGINX with OpenTelemetry we created a small sample app that had a frontend application in Node.js, that called an NGINX, which acted as a reverse proxy for a backend application in Python.
Our goal was to create a re-usable docker-compose that would not only show
people how to instrument NGINX with OpenTelemetry, but also how a distributed
trace crossing the web server would look like.
While Jaeger showed us a trace flowing from the frontend application down to the NGINX, the connection between NGINX and Python app was not visible: we had two disconnected traces.
This came as a surprise, because in a prior test with a Java application as backend we were able to see traces going from NGINX to that downstream application.
Steps to reproduce
Follow the instructions on how you can put NGINX between two services.
Replace the Java-based application with a Python application, e.g. put following
three files into the backend folder instead:
app.py:import time import redis from flask import Flask app = Flask(__name__) cache = redis.Redis(host='redis', port=6379) def get_hit_count(): retries = 5 while True: try: return cache.incr('hits') except redis.exceptions.ConnectionError as exc: if retries == 0: raise exc retries -= 1 time.sleep(0.5) @app.route('/') def hello(): count = get_hit_count() return 'Hello World! I have been seen {} times.\n'.format(count)Dockerfile:FROM python:3.10-alpine WORKDIR /code ENV FLASK_APP=app.py ENV FLASK_RUN_HOST=0.0.0.0 RUN apk add --no-cache gcc musl-dev linux-headers COPY requirements.txt requirements.txt RUN pip install -r requirements.txt RUN opentelemetry-bootstrap -a install EXPOSE 5000 COPY . . CMD ["opentelemetry-instrument", "--traces_exporter", "otlp_proto_http", "--metrics_exporter", "console", "flask", "run"]requirements.txt:flask redis opentelemetry-distro opentelemetry-exporter-otlp-proto-http
Update the docker-compose.yml with the following:
version: '2'
services:
  jaeger:
    image: jaegertracing/all-in-one:latest
    ports:
      - '16686:16686'
  collector:
    image: otel/opentelemetry-collector:latest
    command: ['--config=/etc/otel-collector-config.yaml']
    volumes:
      - ./otel-collector-config.yaml:/etc/otel-collector-config.yaml
  nginx:
    image: nginx-otel
    volumes:
      - ./opentelemetry_module.conf:/etc/nginx/conf.d/opentelemetry_module.conf
      - ./default.conf:/etc/nginx/conf.d/default.conf
  backend:
    build: ./backend
    image: backend-with-otel
    environment:
      - OTEL_EXPORTER_OTLP_ENDPOINT=http://collector:4318/v1/traces
      - OTEL_EXPORTER_OTLP_PROTOCOL=http/protobuf
      - OTEL_SERVICE_NAME=python-app
  redis:
    image: 'redis:alpine'
  frontend:
    build: ./frontend
    image: frontend-with-otel
    ports:
      - '8000:8000'
    environment:
      - OTEL_EXPORTER_OTLP_ENDPOINT=http://collector:4318/
      - OTEL_EXPORTER_OTLP_PROTOCOL=http/protobuf
      - OTEL_SERVICE_NAME=frontend
Spin up that environment by running docker compose up1 and send some
requests to the frontend with curl localhost:8000
What did you expect to see?
In the Jaeger UI at localhost:16686 you would expect to see traces going
from the frontend through NGINX down to the python-app.
What did you see instead?
In the Jaeger UI at localhost:16686 you will see two traces, one going from
the frontend down to NGINX, and another one only for the python-app.
The solution
The hints
Since the setup worked with a Java application in the backend, we knew that the problem was either caused by the Python application or by the combination of the NGINX instrumentation and the Python application.
We could quickly rule out that the Python application alone was the issue: trying out a simple Node.js application as backend, we got the same result: two traces, one from frontend to NGINX, another one for the Node.js application alone.
With that, we knew that we had a propagation issue: the trace context was not transferred successfully from NGINX down to the Python and Node.js application.
The analysis
Knowing that the issue does not occur with Java and that it is likely a broken propagation, we knew what we had to do: we needed to see the trace headers.
Gladly, the instrumentations for Java and Python have a feature that allows us to capture HTTP request & response headers as span attributes easily.
By providing a comma-separated list of HTTP header names via the environment
variables OTEL_INSTRUMENTATION_HTTP_CAPTURE_HEADERS_SERVER_REQUEST and
OTEL_INSTRUMENTATION_HTTP_CAPTURE_HEADERS_SERVER_RESPONSE we can define which
HTTP headers we want to capture. In our case we put all potential propagation
headers:
OTEL_INSTRUMENTATION_HTTP_CAPTURE_HEADERS_SERVER_REQUEST=tracestate,traceparent,baggage,X-B3-TraceId
In our docker-compose-based example we simply can add it to the definition of
our backend service:
backend:
  build: ./backend
  image: backend-with-otel
  environment:
    - OTEL_EXPORTER_OTLP_ENDPOINT=http://collector:4318/v1/traces
    - OTEL_EXPORTER_OTLP_PROTOCOL=http/protobuf
    - OTEL_SERVICE_NAME=python-app
    - OTEL_INSTRUMENTATION_HTTP_CAPTURE_HEADERS_SERVER_REQUEST=tracestate,traceparent,baggage,X-B3-TraceId
Once again we ran docker compose up1 to bring up our sample app and we send
some request with curl localhost:8080 to the frontend application.
In Jaeger we still see that the traces are disconnected. However, when we look into one of those traces, we can see the collected request headers from NGINX to backend:
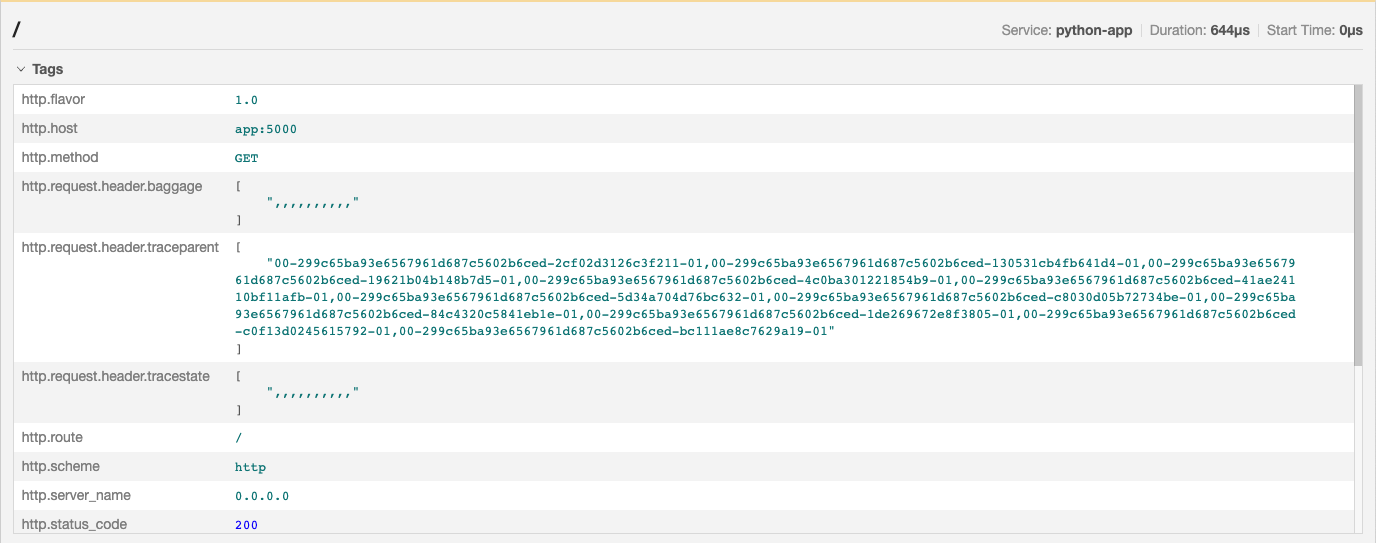
There it is! The trace headers (baggage, traceparent, tracestate) are send
as multiple header fields: the NGINX module added the value of each of those
headers again and again, and since having multi value headers is covered by
RFC7230, this didn’t lead to an issue immediately.
We tested the capability to correlate from NGINX to a downstream service with a
Java application. And, without reading into the source code of the OTel Java
SDK, it looks like that Java is flexible in taking a traceparent with multiple
values, even though such format is invalid per the W3C Trace Context
specification. So propagation from NGINX to the Java service worked, while in
contrast, Python (and other languages) do not provide that flexibility and
propagation from NGINX to the downstream service silently fails.
Note, that we are not suggesting that the other languages should have the same
flexibility as Java has with reading traceparent or vice-versa: the bug lives
in the NGINX module and we need to fix that.
The fix
To fix our problem we added some checks to the module for NGINX, that make sure that the trace headers are only set once.
This fix is contained in the v1.0.1 release of the otel-webserver-module.
This means you can update the Dockerfile to install the NGINX module like the
following:
FROM nginx:1.18
ADD https://github.com/open-telemetry/opentelemetry-cpp-contrib/releases/download/webserver%2Fv1.0.1/opentelemetry-webserver-sdk-x64-linux.tgz /opt
RUN cd /opt ; tar xvfz opentelemetry-webserver-sdk-x64-linux.tgz
RUN cd /opt/opentelemetry-webserver-sdk; ./install.sh
ENV LD_LIBRARY_PATH=$LD_LIBRARY_PATH:/opt/opentelemetry-webserver-sdk/sdk_lib/lib
RUN echo "load_module /opt/opentelemetry-webserver-sdk/WebServerModule/Nginx/ngx_http_opentelemetry_module.so;\n$(cat /etc/nginx/nginx.conf)" > /etc/nginx/nginx.conf
COPY default.conf /etc/nginx/conf.d
COPY opentelemetry_module.conf /etc/nginx/conf.d
docker-composeis deprecated. For details, see Migrate to Compose V2. ↩︎ ↩︎