Announcing a Community Demo for OpenTelemetry
Blog posts are not updated after publication. This post is more than a year old, so its content may be outdated, and some links may be invalid. Cross-verify any information before relying on it.
TL;DR
The OpenTelemetry community has taken a good preexisting demo (thanks, Google!) and is in the process of making it even better. Every GA SDK (besides Swift) will be represented, demo support will be extended to Metrics and Logs, and canonical scenarios will be documented for each signal, with fault injection, and more!
If you want to skip the details then clone our
repository then run
docker compose up1 from the command line. There are a couple
technology requirements
so be sure to check those out too.
The demo takes 15-20 minutes to build the first time so we encourage you to do some stretching and take a water break in the meantime.
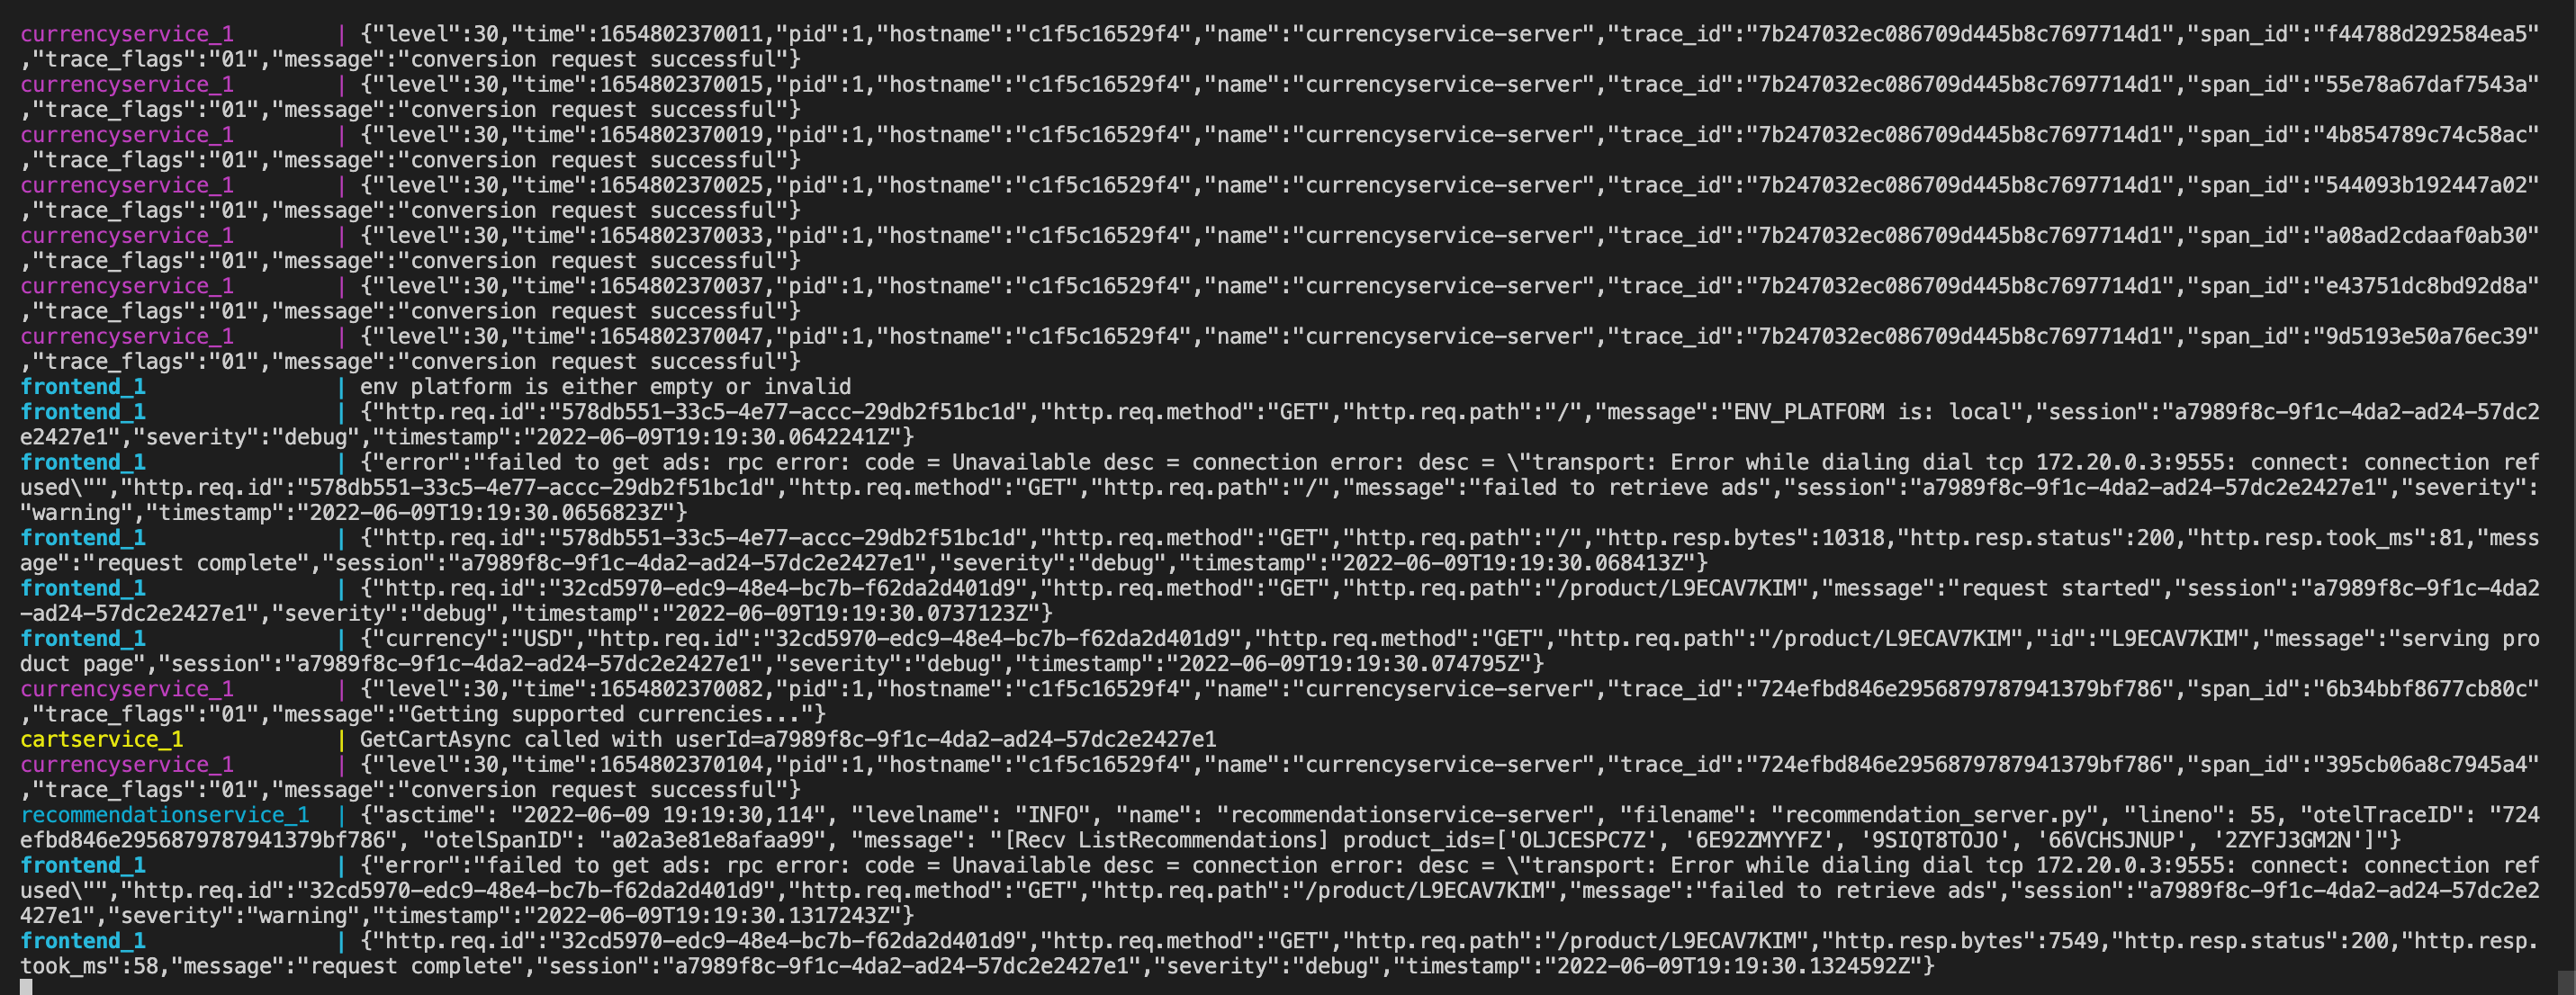
Your command line output should look like this:

Once the images are built you can access the web store at: http://localhost:8080
And the Jaeger UI at: http://localhost:8080/jaeger/ui
Congratulations! You can now indulge in retail therapy and submit telemetry. A true victory.
Success of the Commons
There are a couple universal problems that are the driving force behind our joint demo effort.
As OpenTelemetry matures, users and enterprises are increasingly looking for best practice guides on how to onboard their services to the new paradigm or demo applications so that they can try out the new tools themselves. However, community working groups and vendors lack a singular sophisticated platform to demonstrate their technologies on. Greeting the world can only get us so far.
Multiple vendors have written their own demo applications but are wholly responsible for the development and ongoing support. The existing demos are all feature incomplete in their own ways with missing languages, restrictions on backend choice, and they’re overly reliant on instrumentation libraries.
Project Goals
- Provide developers with a robust sample application they can use in learning OpenTelemetry instrumentation.
- Provide observability vendors with a single, well-supported, demo platform that they can further customize or simply use OOB.
- Provide the OpenTelemetry community with a living artifact that demonstrates the features and capabilities of OTel APIs, SDKs, and tools.
- Provide OpenTelemetry maintainers and working groups a platform to demonstrate new features/concepts in real world like scenarios.
Current State
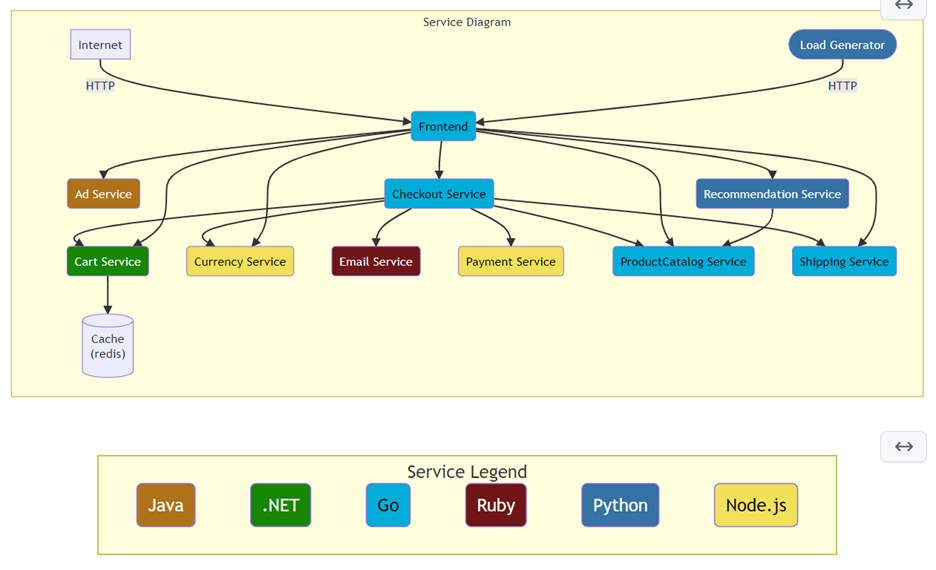
As a starting point, we have selected a fork of the popular GCP microservices demo. Our first feature additions have been to simplify local deployment by consolidating the project onto a single docker compose file, updating the documentation, and replacing a preexisting service with a Ruby example. Otherwise the preexisting feature set from the GCP demo remains the same:
- 10 application microservice with support for 6 languages (C#, Go, Java,
Node.js, Python, and Ruby)
- Ruby support was added within the last 2 weeks of publishing date
- Designed to work on docker locally
- Uses Redis cache
- Auto-instrumentation using instrumentation libraries Tracing support for the gRPC, Redis, and HTTP libraries
- Jaeger visualizations for distributed traces, forwarded by OpenTelemetry collector
- Always on sampling (100% of telemetry is submitted) and synthetic load generation
Current Architecture

BYOB (Bring Your Own Backend)
Jaeger is great (really) but what if you want to try this out with your APM vendor of choice? You can send data to your preferred backend by simply changing the Collector config file to use their Collector exporter or by using your vendor’s fork of our demo.
Lightstep has an excellent blog they just published on how to get started sending data to power their experiences from their forked version of our demo.
Future State
Upcoming New Features
We have a lot of exciting improvements that are planned or in progress to turn this application into the canonical example of the full power of OpenTelemetry. Below is a semi-exhaustive list of upcoming features but we’re not limiting ourselves to just the items listed here.
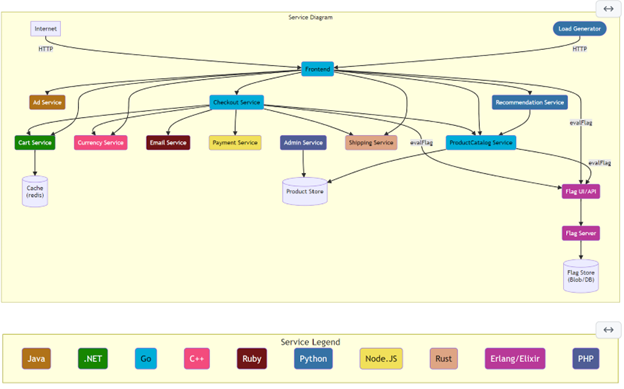
- Language examples for C++, Erlang/Elixir, PHP, and Rust
- Extend support to Metrics and Logs for all GA SDKs
- Visualization components to consume Metrics
- Implementation of multiple instrumentation techniques
- Auto-instrumentation using the agent in a sidecar
- Manual instrumentation of all signals
- Service Level Objective (SLO) definition and tracking
- Additional instrumentation libraries introduced where needed
- Demonstrations of the ability to add Baggage and other custom tags
- Continue to build on other cloud native technologies like:
- Kubernetes
- gRPC
- OpenFeature
- OpenSLO
- etc.
- An enhanced OpenTelemetry Collector gateway capabilities for ingestion, transformation, and export
- Probability based sampling
- Feature flag service to demonstrate various scenarios like fault injection and how to emit telemetry from a feature flag reliant service
Future Architecture

Going Forward
We’re still at the beginning of our journey but there’s great momentum behind this project. If you’re interested in contributing we’d love your support. There are links in our GitHub repository on how to get involved and you can track our overall progress from there.
Interesting Links
docker-composeis deprecated. For details, see Migrate to Compose V2. ↩︎