Go Web-app Instrumentation
Blog posts are not updated after publication. This post is more than a year old, so its content may be outdated, and some links may be invalid. Cross-verify any information before relying on it.
In this blog post, you will learn hands-on how to create and visualize traces with OpenTelemetry Go without prior knowledge.
We will start with creating a simple to-do app that uses Mongo and the Gin framework. Then, we will send tracing data to Jaeger Tracing for visualization. You can find all the relevant files in this GitHub repository.

Hello world: OpenTelemetry Go example
We will start by creating our to-do service and installing two libraries (Gin and Mongo) to understand how instrumentations work.
Step 1: Create main.go file for our to-do app
Install Gin and Mongo-driver
go get -u github.com/gin-gonic/gin
go get go.mongodb.org/mongo-driver/mongo
Set up gin and mongo to listen on “/todo”
Create some to-do’s to seed Mongo
package main
import (
    "context"
    "net/http"
    "github.com/gin-gonic/gin"
    "go.mongodb.org/mongo-driver/bson"
    "go.mongodb.org/mongo-driver/mongo"
    "go.mongodb.org/mongo-driver/mongo/options"
)

var client * mongo.Client

func main() {
    connectMongo()
    setupWebServer()
}

func connectMongo() {
    opts: = options.Client()
    opts.ApplyURI("mongodb://localhost:27017")
    client, _ = mongo.Connect(context.Background(), opts)
    //Seed the database with todo's
    docs: = [] interface {} {
        bson.D {
                {
                    "id", "1"
                }, {
                    "title", "Buy groceries"
                }
            },
            bson.D {
                {
                    "id", "2"
                }, {
                    "title", "install Aspecto.io"
                }
            },
            bson.D {
                {
                    "id", "3"
                }, {
                    "title", "Buy dogz.io domain"
                }
            },
    }
    client.Database("todo").Collection("todos").InsertMany(context.Background(), docs)
}

func setupWebServer() {
    r: = gin.Default()
    r.GET("/todo", func(c * gin.Context) {
        collection: = client.Database("todo").Collection("todos")
        //Important: Make sure to pass c.Request.Context() as the context and not c itself - TBD
        cur, findErr: = collection.Find(c.Request.Context(), bson.D {})
        if findErr != nil {
            c.AbortWithError(500, findErr)
            return
        }
        results: = make([] interface {}, 0)
        curErr: = cur.All(c, & results)
        if curErr != nil {
            c.AbortWithError(500, curErr)
            return
        }
        c.JSON(http.StatusOK, results)
    })
    _ = r.Run(":8080")
}
Now that our small todo app is ready, let’s introduce OpenTelemetry.
Step 2: Install OpenTelemetry Go
We will be configuring OpenTelemetry to instrument our Go app.
To install the OTel SDK, run:
go get go.opentelemetry.io/otel /
go.opentelemetry.io/otel/sdk /
Instrument our Gin and Mongo libraries to generate traces.
Gin & Mongo instrumentation: Install otelgin & otelmongo
go get go.opentelemetry.io/contrib/instrumentation/github.com/gin-gonic/gin/otelgin /
go get go.opentelemetry.io/contrib/instrumentation/go.mongodb.org/mongo-driver/mongo/otelmongo
Gin instrumentation: gin.Context
We previously discussed the idea of context propagation – the way to transfer metadata between distributed services to correlate events in our system.
The Gin framework has its own type gin.Context which gets passed as a parameter to an HTTP handler. However, the context that should be passed down to the mongo operations is the standard Go library Context object, available in gin.Context.Request.Context.
//Make sure to pass c.Request.Context() as the context and not c itself
cur, findErr := collection.Find(c.Request.Context(), bson.D{})
So make sure that you pass the Context to the MongoDB operation. Check out this issue for more info.
We now have our todo app ready and instrumented. It’s time to utilize OpenTelemetry to its full potential. Our ability to visualize traces is where the true troubleshooting power of this technology comes into play.
For visualization, we’ll be using the open source Jaeger Tracing.
Visualization with Jaeger
OpenTelemetry Go and Jaeger Tracing: Export traces to Jaeger
Jaeger Tracing is a suite of open source projects managing the entire distributed tracing “stack”: client, collector, and UI. Jaeger UI is the most commonly used open source to visualize traces.
Here’s what the setup looks like:
Install the Jaeger exporter
go get go.opentelemetry.io/otel/exporters/jaegerCreate a tracing folder and a jaeger.go file
Add the following code to the file
package tracing
import (
    "go.opentelemetry.io/otel/exporters/jaeger"
    "go.opentelemetry.io/otel/sdk/resource"
    sdktrace "go.opentelemetry.io/otel/sdk/trace"
    semconv "go.opentelemetry.io/otel/semconv/v1.4.0"
)

func JaegerTracerProvider()(*sdktrace.TracerProvider, error) {
    exp, err: = jaeger.New(jaeger.WithCollectorEndpoint(jaeger.WithEndpoint("http://localhost:14268/api/traces")))
    if err != nil {
        return nil, err
    }
    tp: = sdktrace.NewTracerProvider(
        sdktrace.WithBatcher(exp),
        sdktrace.WithResource(resource.NewWithAttributes(
            semconv.SchemaURL,
            semconv.ServiceNameKey.String("todo-service"),
            semconv.DeploymentEnvironmentKey.String("production"),
        )),
    )
    return tp, nil
}
Go back to the main.go file and modify our code to use the JaegerTracerProvider function we just created
func main() {
    tp, tpErr: = tracing.JaegerTracerProvider()
    if tpErr != nil {
        log.Fatal(tpErr)
    }
    otel.SetTracerProvider(tp)
    otel.SetTextMapPropagator(propagation.NewCompositeTextMapPropagator(propagation.TraceContext {}, propagation.Baggage {}))
    connectMongo()
    setupWebServer()
}
Next, we are going to hook up the instrumentations we installed.
Add the Mongo instrumentation. In our connectMongo function by adding this line
opts.Monitor = otelmongo.NewMonitor()The function should look like this:
func connectMongo() {
    opts: = options.Client()
    //Mongo OpenTelemetry instrumentation
    opts.Monitor = otelmongo.NewMonitor()
    opts.ApplyURI("mongodb://localhost:27017")
    client, _ = mongo.Connect(context.Background(), opts)
    //Seed the database with some todo's
    docs: = [] interface {} {
        bson.D {
                {
                    "id", "1"
                }, {
                    "title", "Buy groceries"
                }
            },
            bson.D {
                {
                    "id", "2"
                }, {
                    "title", "install Aspecto.io"
                }
            },
            bson.D {
                {
                    "id", "3"
                }, {
                    "title", "Buy dogz.io domain"
                }
            },
    }
    client.Database("todo").Collection("todos").InsertMany(context.Background(), docs)
}
Now, add the Gin instrumentation.
Go to the startWebServer function and add this line right after we create the gin instance
r.Use(otelgin.Middleware("todo-service"))The function should look like this
func startWebServer() {
    r: = gin.Default()
    //Gin OpenTelemetry instrumentation
    r.Use(otelgin.Middleware("todo-service"))
    r.GET("/todo", func(c * gin.Context) {
        collection: = client.Database("todo").Collection("todos")
        //make sure to pass c.Request.Context() as the context and not c itself
        cur, findErr: = collection.Find(c.Request.Context(), bson.D {})
        if findErr != nil {
            c.AbortWithError(500, findErr)
            return
        }
        results: = make([] interface {}, 0)
        curErr: = cur.All(c, & results)
        if curErr != nil {
            c.AbortWithError(500, curErr)
            return
        }
        c.JSON(http.StatusOK, results)
    })
    _ = r.Run(":8080")
}
For the complete
main.gofile, see below. Now we’re finally ready to export to Jaeger.package main import ( "context" "log" "net/http" "github.com/aspecto-io/opentelemetry-examples/tracing" "github.com/gin-gonic/gin" "go.mongodb.org/mongo-driver/bson" "go.mongodb.org/mongo-driver/mongo" "go.mongodb.org/mongo-driver/mongo/options" "go.opentelemetry.io/contrib/instrumentation/github.com/gin-gonic/gin/otelgin" "go.opentelemetry.io/contrib/instrumentation/go.mongodb.org/mongo-driver/mongo/otelmongo" "go.opentelemetry.io/otel" "go.opentelemetry.io/otel/propagation" ) var client * mongo.Client func main() { //Export traces to Jaeger tp, tpErr: = tracing.JaegerTracerProvider() if tpErr != nil { log.Fatal(tpErr) } otel.SetTracerProvider(tp) otel.SetTextMapPropagator(propagation.NewCompositeTextMapPropagator(propagation.TraceContext {}, propagation.Baggage {})) connectMongo() startWebServer() } func connectMongo() { opts: = options.Client() //Mongo OpenTelemetry instrumentation opts.Monitor = otelmongo.NewMonitor() opts.ApplyURI("mongodb://localhost:27017") client, _ = mongo.Connect(context.Background(), opts) //Seed the database with some todo's docs: = [] interface {} { bson.D { { "id", "1" }, { "title", "Buy groceries" } }, bson.D { { "id", "2" }, { "title", "install Aspecto.io" } }, bson.D { { "id", "3" }, { "title", "Buy dogz.io domain" } }, } client.Database("todo").Collection("todos").InsertMany(context.Background(), docs) } func startWebServer() { r: = gin.Default() //gin OpenTelemetry instrumentation r.Use(otelgin.Middleware("todo-service")) r.GET("/todo", func(c * gin.Context) { collection: = client.Database("todo").Collection("todos") //Make sure to pass c.Request.Context() as the context and not c itself cur, findErr: = collection.Find(c.Request.Context(), bson.D {}) if findErr != nil { c.AbortWithError(500, findErr) return } results: = make([] interface {}, 0) curErr: = cur.All(c, & results) if curErr != nil { c.AbortWithError(500, curErr) return } c.JSON(http.StatusOK, results) }) _ = r.Run(":8080") }
Export traces to Jaeger
- Run the todo-service with
go run main.go. - To generate some traces, make an HTTP GET request to http://localhost:8080/todo.
- To view the traces, open Jaeger at http://localhost:16686/search.
You can now see the Jaeger UI. Select todo-service and click on Find traces. You should see your trace on the right:
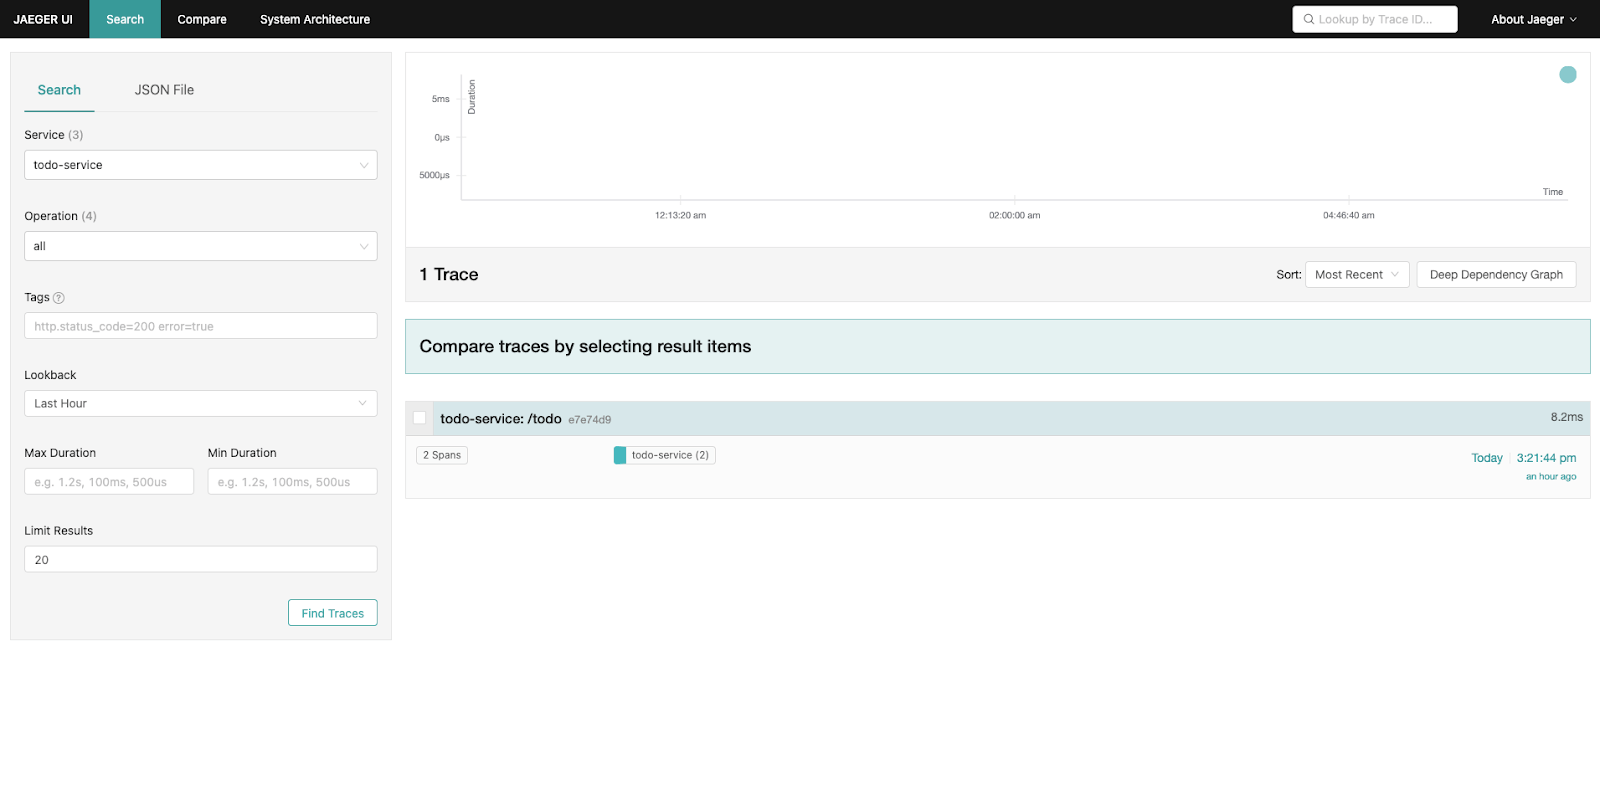
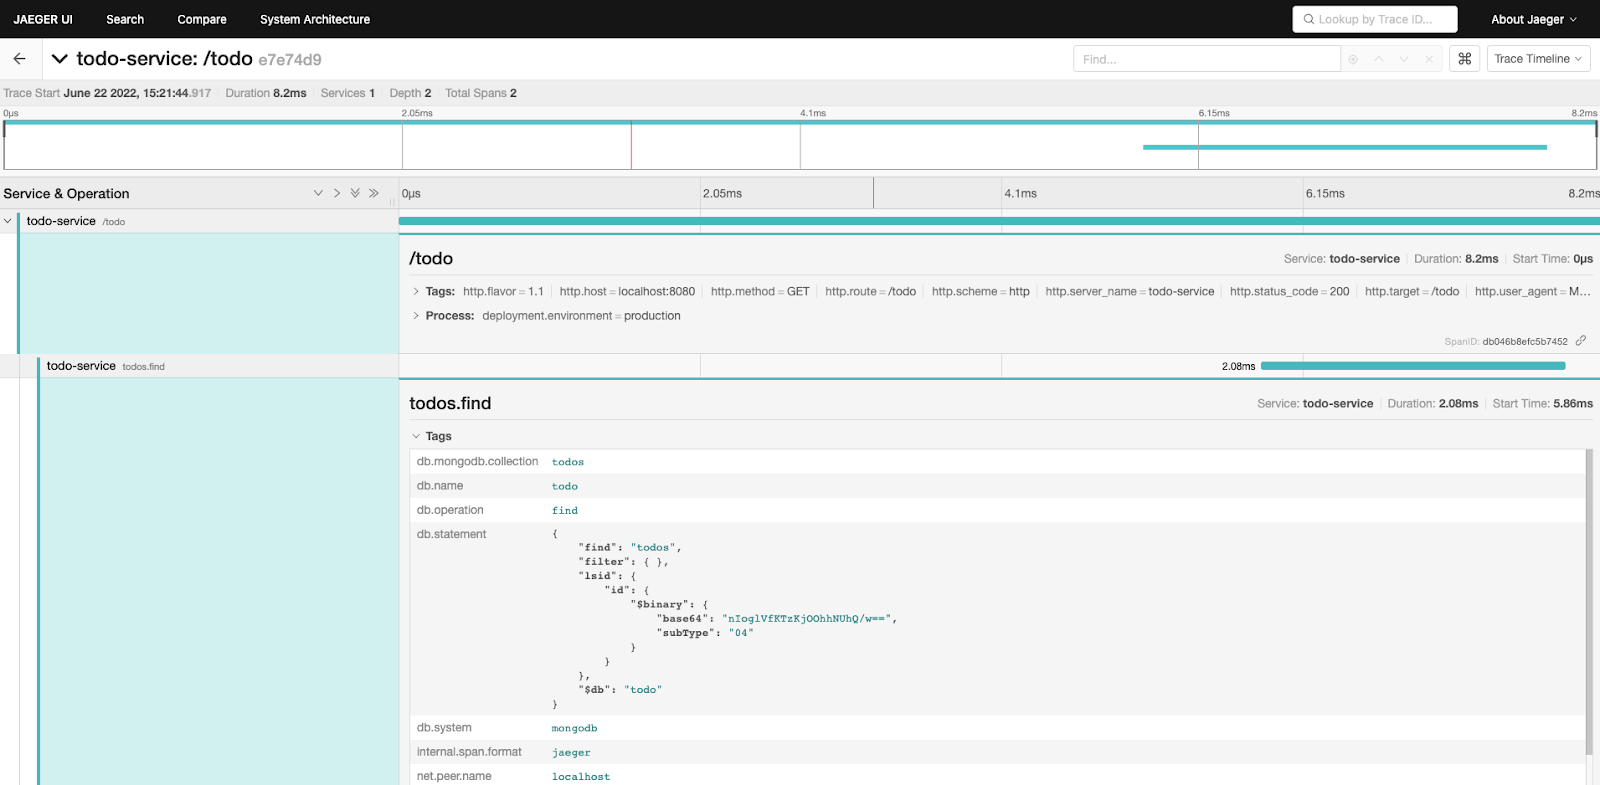
Jaeger UI displays OpenTelemetry traces in go for our todo-service By clicking the trace, you can drill down and see more details about it that allow you to further investigate on your own:
Summary
That’s all folks! We hope this guide was informative and easy to follow. You can find all files ready to use in our GitHub repository.
A version of this article was originally posted on the Aspecto blog.