Improved troubleshooting using k8s metadata
Blog posts are not updated after publication. This post is more than a year old, so its content may be outdated, and some links may be invalid. Cross-verify any information before relying on it.
The most up to date information for how to enhance telemetry with Kubernetes metadata can be found in the docs. See Getting Started with Kubernetes for more info.
Attaching Kubernetes resource metadata to OpenTelemetry traces is useful to identify which resource (such as a pod) is failing or having performance problems. It is also useful for correlating across other signals, for example: you can correlated logs and spans that were generated by the same pod.
In this article, you’ll learn how to configure the OpenTelemetry Collector to use the k8sattributesprocessor in different scenarios.
Details of the OpenTelemetry Collector pipeline won’t be covered in this post. For those details, refer to the collector documentation.
How K8s attributes are attached
At a high level, K8s attributes are attached to traces as resources. This is for two reasons:
- K8s attributes fit the definition of what a resource is: an entity for which telemetry is recorded
- It centralizes this metadata, which is relevant for any generated span.
Let’s dive in and see how to do it!
Using k8sattributes processor
This is an OpenTelemetry processor that automatically discovers pod metadata and
attaches it to a resource associated with the spans generated by that pod. If
the pod belongs to a Deployment or a ReplicaSet, it will also discover it’s
attributes.
Some attributes we can attach to the resource are:
- Node name
k8s.node.name - Pod name
k8s.pod.name - Pod UID
k8s.pod.uid - Namespace
k8s.namespace.name - Deployment name,
k8s.deployment.nameif the pod was created by a deployment
Such attributes adhere to OpenTelemetry semantic conventions. For details, see the Kubernetes resource semantic conventions.
The processor internally maintains a list of pods and an associated attribute, usually the IP address of the pod, and uses this attribute to know which pod generates a certain span.
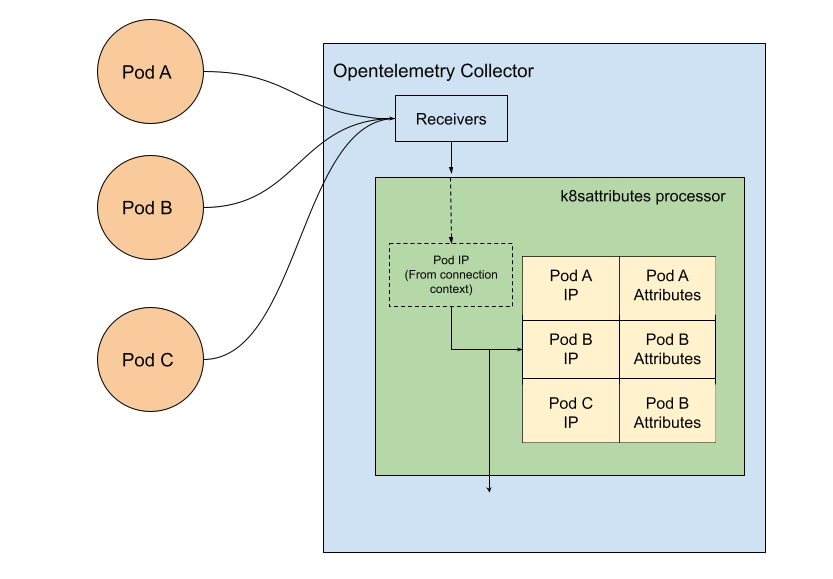
In the figure above you can see how the data flows: The table of pods is fetched using Kubernetes API, while the pod IP is extracted from the connection context between the pod and the collector.
The k8sattributesprocessor can work in different modes depending on how the
collector is configured. Let’s explore one common scenario, when the collector
is deployed as daemonset.
Daemonset mode
Let’s take a look at how we can configure the collector in daemonset mode, also known as an agent mode in the k8sattributes documentation.
When we deploy the collector in daemonset mode, we have one collector pod per
node. We need to configure the collector service account to have permissions to
fetch all pod information. In order to do that, we will create a ClusterRole
with the necessary permissions.
Here are the minimum permissions required to make the k8sattributesprocessor
work:
apiVersion: rbac.authorization.k8s.io/v1
kind: ClusterRole
metadata:
  name: otel-collector
rules:
  - apiGroups: ['']
    resources: ['pods', 'namespaces']
    verbs: ['get', 'watch', 'list']
Next, deploy the collector in daemonset mode. We recommend that you set a filter to only fetch the pods that belong to the node in which the collector is deployed. This is because if you have a large cluster, you don’t want to maintain a huge list of pods.
This is the manifest used in this blog to show how the processor works:
apiVersion: opentelemetry.io/v1alpha1
kind: OpenTelemetryCollector
metadata:
  name: otel-collector-daemonset
spec:
  mode: daemonset
  image: ghcr.io/open-telemetry/opentelemetry-collector-releases/opentelemetry-collector-contrib:0.47.0
  serviceAccount: attributes-account
  env:
    - name: KUBE_NODE_NAME
      valueFrom:
        fieldRef:
          apiVersion: v1
          fieldPath: spec.nodeName
  config: |
    receivers:
      jaeger:
          protocols:
              grpc:
              thrift_binary:
              thrift_compact:
              thrift_http:
      otlp:
          protocols:
              grpc:
              http:

    processors:
         k8sattributes:
             filter:
                 node_from_env_var: KUBE_NODE_NAME
    exporters:
      jaeger:
        endpoint: jaeger-all-in-one-collector:14250
        tls:
          insecure: true

    service:
      pipelines:
        traces:
          receivers: [otlp, jaeger]
          processors: [k8sattributes]
          exporters: [jaeger]
The main parts to note are that it uses the contrib collector image. The
k8sattributesprocessor is not part of the OpenTelemetry Collector core, but
the contrib distribution has it. Other things to notice are the filter mentioned
above, and the use of a previously-created specific service account, which
contains the permissions to fetch the pod list.
Next, deploy the manifest and the vert.x example app to generate some traces.
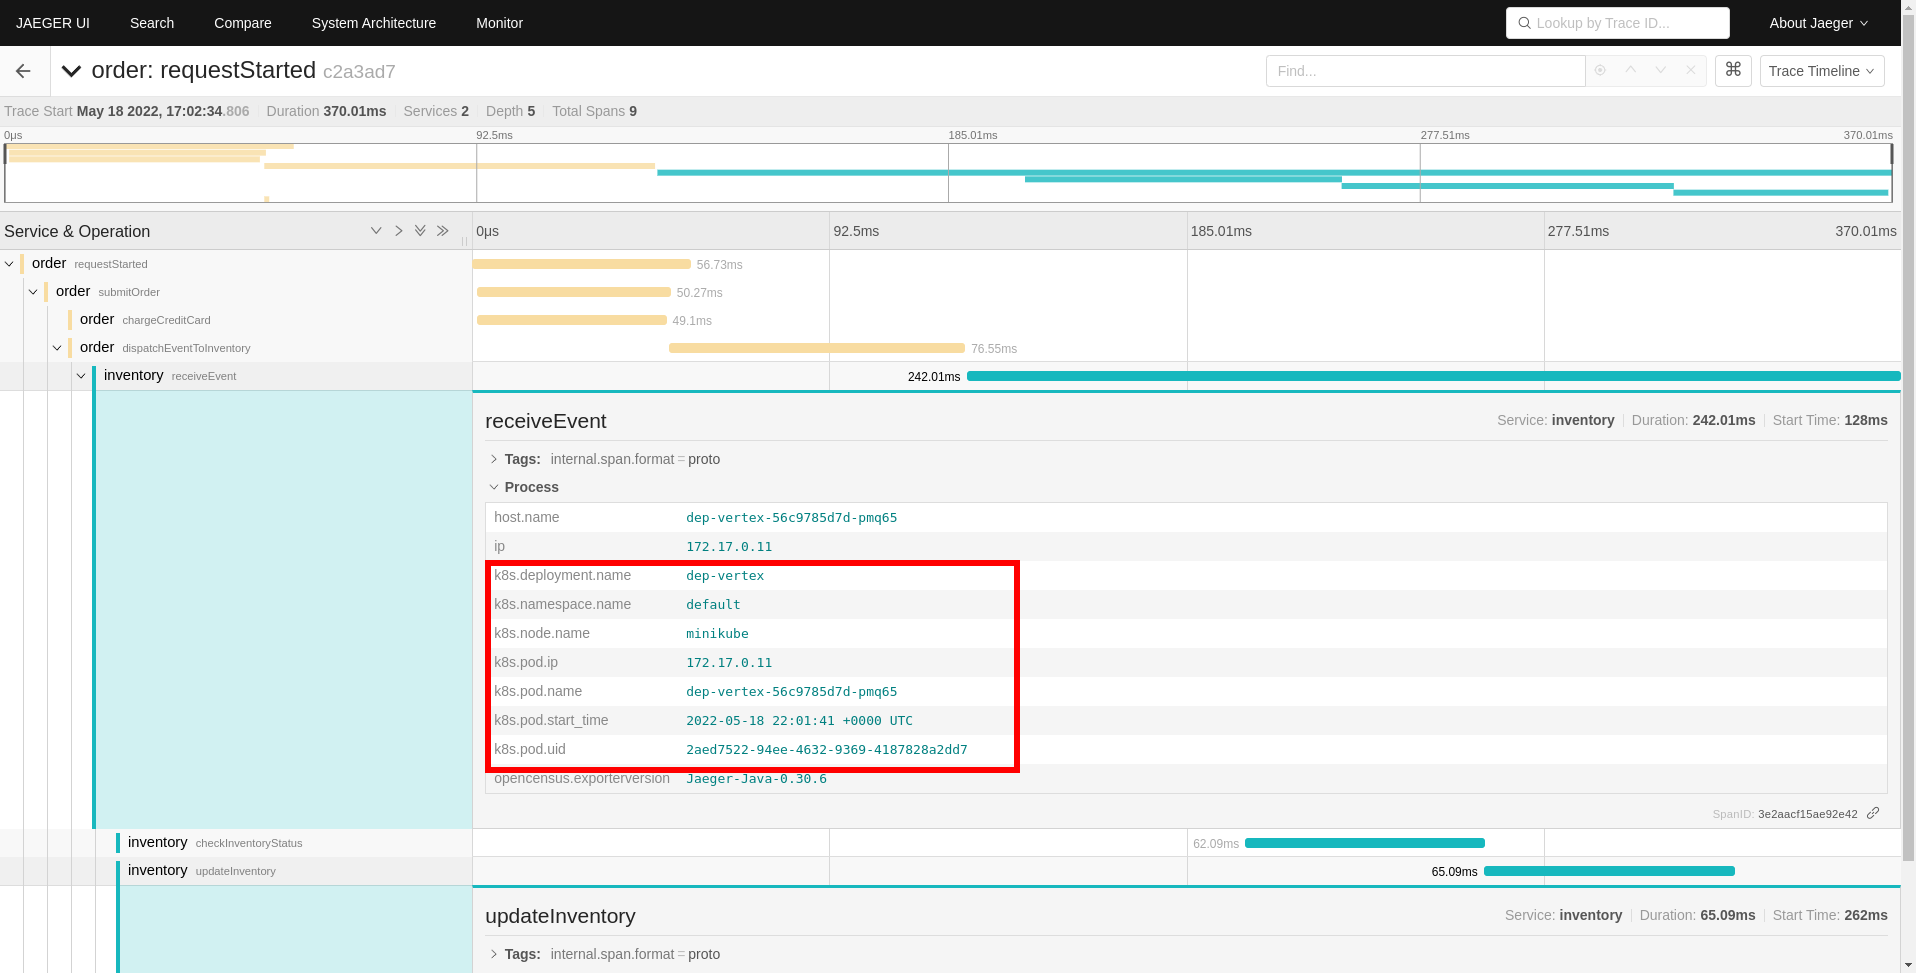
As you can see, each span of the trace now has the corresponding pod attributes attached to it.
You can restrict the configuration above to a certain namespace if you add the
namespace on the k8sattributesprocessor filter like this:
processors:
  k8sattributes:
    filter:
      namespace: my_namespace
In this way, you can create a Role and don’t need to create a ClusterRole,
reducing the scope of the collector service account to a single namespace.
Using Resource detector processor
As of recently, the OpenTelemetry operator sets the
OTEL_RESOURCE_ATTRIBUTES environment variable on the collector container with
the K8s pod attributes. This lets you to use the resource detector processor,
which attaches the environment variable values to the spans. This only works
when the collector is deployed in sidecar mode.
For example, if you deploy the following manifest:
apiVersion: opentelemetry.io/v1alpha1
kind: OpenTelemetryCollector
metadata:
  name: sidecar-for-my-app
spec:
  mode: sidecar
  image: ghcr.io/open-telemetry/opentelemetry-collector-releases/opentelemetry-collector-contrib:0.47.0
  config: |
    receivers:
      jaeger:
        protocols:
          grpc:
          thrift_binary:
          thrift_compact:
          thrift_http:
      otlp:
        protocols:
          grpc:
          http:

    processors:
      resourcedetection:
        detectors: [env]
        timeout: 2s
        override: false

    exporters:
      jaeger:
        endpoint: jaeger-all-in-one-collector:14250
        tls:
          insecure: true

    service:
      pipelines:
        traces:
          receivers: [otlp, jaeger]
          processors: [resourcedetection]
          exporters: [jaeger]
And then deploy the vert.x example app, you can see the
OTEL_RESOURCE_ATTRIBUTES environment variable gets injected with some values
in the sidecar container. Some of them use the Kubernetes downward API to get
the attribute values.
Here’s an example of the value of the environment variable:
- name: OTEL_RESOURCE_ATTRIBUTES
  value: k8s.deployment.name=dep-vert-x,k8s.deployment.uid=ef3fe26b-a690-4746-9119-d2dbd94b469f,k8s.namespace.name=default,k8s.node.name=$(OTEL_RESOURCE_ATTRIBUTES_NODE_NAME),k8s.pod.name=(OTEL_RESOURCE_ATTRIBUTES_POD_NAME),k8s.pod.uid=$(OTEL_RESOURCE_ATTRIBUTES_POD_UID),k8s.replicasetname=dep-vert-x-59b6f76585,k8s.replicaset.uid=5127bc38-e298-40e1-95df-f4a777e3176c
Learn more
This post covers how to configure the OpenTelemetry Collector to attach Kubernetes resource metadata as resource attributes to OpenTelemetry traces. The scenarios covered, although basic, illustrate how to add this kind of metadata to traces so that you can incorporate the technique into other more sophisticated scenarios. If you want to learn more about different scenarios or options for configure the processors you can see the K8sattributes processor documentation where you can find more scenarios like sidecar, or when one collector as an agent report to another collector.