Exposing a Collector for cross cluster communication
Blog posts are not updated after publication. This post is more than a year old, so its content may be outdated, and some links may be invalid. Cross-verify any information before relying on it.
Exposing an OpenTelemetry Collector currently requires a
number of configuration steps. The goal of this blog post is to demonstrate
how to establish a secure communication between two collectors in different
Kubernetes clusters.
Details of CRDs and dependency installations are not covered by this post.
Overview
When it comes to making collectors publicly accessible, the first thing that comes to mind is the secure transmission of user data via TLS. However, authentication to the server is at least as important to prevent unauthorized services from sending data.
The OpenTelemetry Collector supports different authentication methods. The most used are probably:
- TLS Authentication
- OpenID Connect (OIDC-Authentication)
- HTTP Basic Authentication
This article focuses on HTTP Basic Authentication for simplicity. It is intended to show how a secure setup can be operated without key management or further third-party services.
For more information about TLS configuration I would like to refer to the article How TLS provides identification, authentication, confidentiality, and integrity and the Collector TLS-Config description on GitHub.
If you are interested in using an external authentication provider, I advise you to have a look at the article Securing your OpenTelemetry Collector by Juraci Paixão Kröhling on this topic. He explains how OpenTelemetry collectors can be secured using the OIDC-Authenticator extension, and how Keycloak can be configured as an authentication provider.
Basic Authentication
The HTTP Basic Authentication mechanism is quite simple. An HTTP user agent
(e.g., a web browser) provides a username and password combination on every
request. Transmitted credentials are included in the HTTP header by the key
Authorization when the connection is established. As a value the
authentication method basic is mentioned first, followed by the encoded
credentials. Note that the credential form is username:password.
In the following example, dXNlci0xOjEyMzQK is the encoding for a combination
of username=user-1 and password=1234. Note to encode or decode base64
values, you can use
# HTTP Header key: value pair
Authorization: Basic <credentials-base64-encoded>

# example: user: user-1 password: 1234
Authorization: Basic dXNlci0xOjEyMzQK
You can easily create your own user password combination using the base64 cli tool.
# encode
$ echo "user-1:1234" | base64
dXNlci0xOjEyMzQK

# decode
$ echo "dXNlci0xOjEyMzQK" | base64 -d
user-1:1234
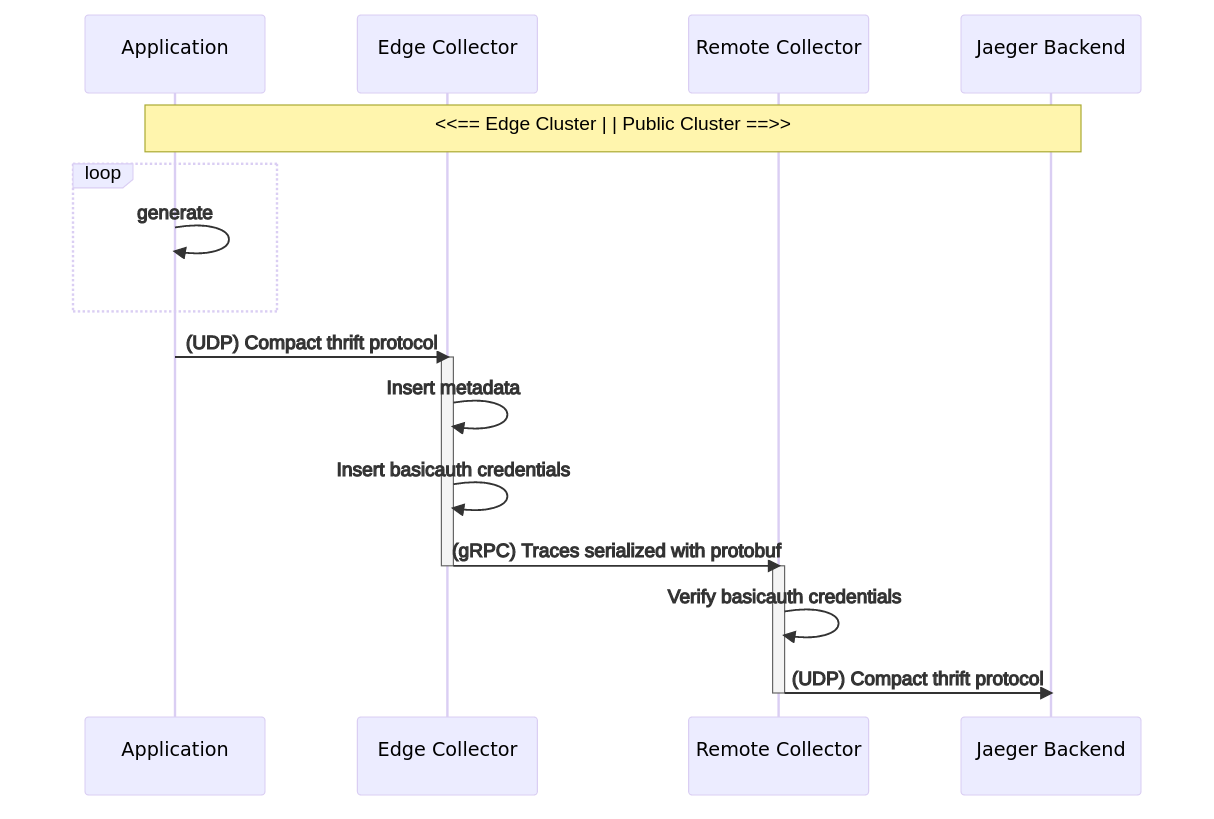
Data flow
The following graph illustrates the target topology. The goal is to transfer traces generated by a test application via a dedicated collector to a publicly accessible cluster. The receiving collector uses the transmitted ‘Basic’ HTTP Authentication credentials to check whether the sender is authorized to store data. Finally, transmitted traces are stored in a Jaeger in-memory
Prerequisites
Interfaces and behavior may change in the future. Therefore, the versions used in this setup are mentioned in brackets.
- A Kubernetes
v1.23.3cluster with a public address with ingress-nginx-controllerv1.2.1installed. - A Kubernetes
v1.23.3edge cluster to create a test cluster. Using Kind is recommended. - Installed OpenTelemetry Operator
v0.58.0on both ends. - Installed Jaeger Operator
v1.37.0on your public cluster. - Installed cert-manager
v1.9.1on your public cluster.
Remote cluster configuration
Since all components except the Jaeger backend depend on a following component, we begin by deploying the backend.
apiVersion: jaegertracing.io/v1
kind: Jaeger
metadata:
  name: my-in-memory
In the next step we create an OpenTelemetry Collector using the
OpenTelemetryCollector CRD. The most important entries are mode, image and
the configured basicauth extension. In the manifest below the mode deployment
was chosen to guarantee that at least one collector pod is available for
processing incoming information. Furthermore the default collector image was
overwritten with the
contrib version.
This is necessary because the
core version does
not contain the
basicauth
extension. This extension was configured with the name basicauth/server and
registered in otlp/basicauth. As
otlp exporter
endpoint the Jaeger in-memory service was configured.
apiVersion: opentelemetry.io/v1alpha1
kind: OpenTelemetryCollector
metadata:
  name: otel-collector-app
spec:
  mode: deployment
  image: otel/opentelemetry-collector-contrib:0.58.0
  config: |
    extensions:
      basicauth/server:
        htpasswd:
          inline: |
            <REPLACE: your backend credentials, e.g.: "user-1:1234">

    receivers:
      otlp/basicauth:
        protocols:
          grpc:
            auth:
              authenticator: basicauth/server

    exporters:
      otlp/jaeger:
        endpoint: my-in-memory-collector:4317
        tls:
          insecure: true
          insecure_skip_verify: true

    service:
      extensions: [basicauth/server]
      pipelines:
        traces:
          receivers: [otlp/basicauth]
          exporters: [otlp/jaeger]
After a successful installation, a pod for the Jaeger backend and the OpenTelemetry Collector should be created in the selected namespace.
NAME                                            READY   STATUS    RESTARTS   AGE
my-in-memory-6c5f5f87c5-rnp99                   1/1     Running   0          4m
otel-collector-app-collector-55cccf4b7d-llczt   1/1     Running   0          3m
Also the following services should be available:
NAME                                      TYPE        CLUSTER-IP      EXTERNAL-IP   PORT(S)                                                    AGE
my-in-memory-agent                        ClusterIP   None            <none>        5775/UDP,5778/TCP,6831/UDP,6832/UDP                         7m
my-in-memory-collector                    ClusterIP   10.245.43.185   <none>        9411/TCP,14250/TCP,14267/TCP,14268/TCP,4317/TCP,4318/TCP    7m
my-in-memory-collector-headless           ClusterIP   None            <none>        9411/TCP,14250/TCP,14267/TCP,14268/TCP,4317/TCP,4318/TCP    7m
my-in-memory-query                        ClusterIP   10.245.91.239   <none>        16686/TCP,16685/TCP                                         7m
otel-collector-app-collector              ClusterIP   10.245.5.134    <none>        4317/TCP                                                    5m
otel-collector-app-collector-headless     ClusterIP   None            <none>        4317/TCP                                                    5m
otel-collector-app-collector-monitoring   ClusterIP   10.245.116.38   <none>        8888/TCP                                                    5m
Finally, cert-manager is configured to automatically request TLS certificates
from Let’s Encrypt and make it available to the
Ingress TLS configuration. The following ClusterIssuer and Ingress entries
expose the otel-collector-app-collector service. Note that you’ll need to
replace values for the email and host fields.
apiVersion: cert-manager.io/v1
kind: ClusterIssuer
metadata:
  name: letsencrypt
  namespace: cert-manager
spec:
  acme:
    server: https://acme-v02.api.letsencrypt.org/directory
    email: your-email-address-here@example.com # REPLACE
    privateKeySecretRef:
      name: letsencrypt
    solvers:
      - http01:
          ingress:
            class: nginx
---
apiVersion: networking.k8s.io/v1
kind: Ingress
metadata:
  name: ingress-otel
  annotations:
    kubernetes.io/ingress.class: nginx
    nginx.ingress.kubernetes.io/backend-protocol: GRPC
    cert-manager.io/cluster-issuer: letsencrypt
spec:
  tls:
    - hosts:
        - your-host # REPLACE your domain endpoint, e.g., traces@example.com
      secretName: letsencrypt
  rules:
    - host: your-host # REPLACE your domain endpoint, e.g., traces@example.com
      http:
        paths:
          - pathType: Prefix
            path: '/'
            backend:
              service:
                name: otel-collector-app-collector
                port:
                  number: 4317
Edge Cluster configuration
In order to be able to determine the origin of the transmitted traces, the span-tags are extended by identifying metadata with the help of the k8sattributes processor. It is available in the OpenTelemetry Collector contrib version. In the next step we create a service account with the necessary permissions. If you want to learn more about the K8s metadata, you can read this post “Improved troubleshooting using K8s metadata”.
apiVersion: rbac.authorization.k8s.io/v1
kind: ClusterRole
metadata:
  name: attributes-role
rules:
  - apiGroups:
      - ''
    resources:
      - pods
    verbs:
      - get
      - list
      - watch
---
apiVersion: rbac.authorization.k8s.io/v1
kind: ClusterRoleBinding
metadata:
  name: attributes-rolebinding
roleRef:
  apiGroup: rbac.authorization.k8s.io
  kind: ClusterRole
  name: attributes-role
subjects:
  - kind: ServiceAccount
    name: attributes-account
---
apiVersion: v1
kind: ServiceAccount
metadata:
  name: attributes-account
Let’s have a quick look on the most important edge collector settings. A
daemonset is used as deployment mode to ensure that one collector instance per
node exists. The basicauth extension contains username and password to
identify itself to the exposed remote collector. More container and node
specific information are provided by the k8sattributes processor via the
Kubernetes
Kubernetes downward-api.
What is not covered is the cluster availability zone and the cluster name. To be
able to identify the reported spans later, they are inserted manually with the
help of the resource processor. Last, the OTLP exporter endpoint has also been
given a placeholder value that must be replaced with your remote cluster domain.
apiVersion: opentelemetry.io/v1alpha1
kind: OpenTelemetryCollector
metadata:
  name: otel-collector-app
spec:
  mode: daemonset
  image: otel/opentelemetry-collector-contrib:0.58.0
  serviceAccount: attributes-account
  env:
    - name: KUBE_NODE_NAME
      valueFrom:
        fieldRef:
          apiVersion: v1
          fieldPath: spec.nodeName

  config: |
    extensions:
      basicauth/client:
        client_auth: # credentials must be consistent with those of the receiving collector.
          username: <REPLACE: your basicauth username, e.g.: "user-1">
          password: <REPLACE: your basicauth password, e.g.: "1234">

    receivers:
      otlp:
        protocols:
          grpc:

    processors:
      resource:
        attributes:
        - key: cloud.availability_zone
          value: <REPLACE: your availability zone, e.g.: "eu-west-1">
          action: insert
        - key: k8s.cluster.name
          value: <REPLACE: your cluster name, e.g.: "edge-cluster-1">
          action: insert
      k8sattributes:
        filter:
          node_from_env_var: KUBE_NODE_NAME

    exporters:
      otlp:
        endpoint: "<REPLACE: your domain endpoint, e.g.: "traces.example.com:443">"
        auth:
          authenticator: basicauth/client
      logging:

    service:
      extensions: [basicauth/client]
      pipelines:
        traces:
          receivers: [otlp]
          processors: [k8sattributes]
          exporters: [otlp,logging]
After a successful installation, a daemonset with the name
otel-collector-app-collector should have been created. This ensures that each
cluster node has a local collector instance up and running.
Deploy trace generator to generate test data
apiVersion: apps/v1
kind: Deployment
metadata:
  name: trace-gen
spec:
  selector:
    matchLabels:
      app: trace-gen
  template:
    metadata:
      labels:
        app: trace-gen
    spec:
      containers:
        - name: trace-gen
          image: ghcr.io/frzifus/jaeger-otel-test:latest
          args:
            [
              '-otel.agent.host=otel-collector-app-collector',
              '-otel.agent.port=4317',
            ]
          env:
            - name: OTEL_SERVICE_NAME
              value: 'local-test-service'
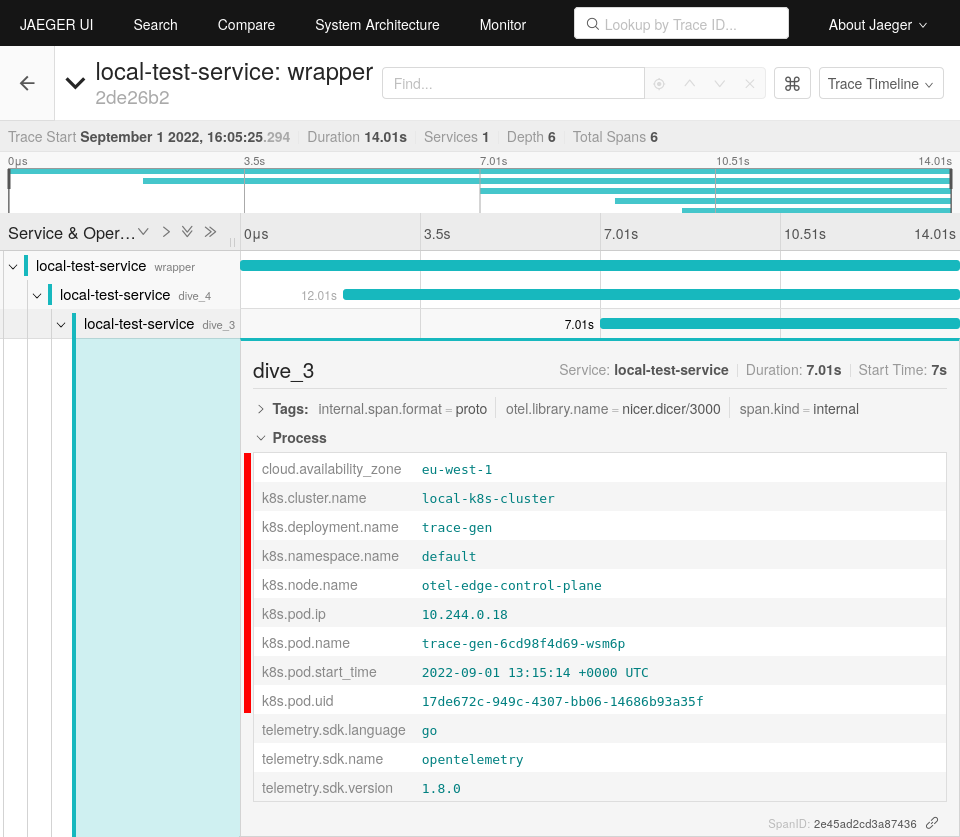
Testing
Now spans generated in the edge cluster should be extended with origin metadata. These are then transferred to the remote cluster and stored in the Jaeger backend. Jaeger itself provides a UI for inspecting transmitted data.
An easy way to reach the UI is by port forwarding to your local system.
$ kubectl port-forward deployments/my-in-memory 16686
Forwarding from 127.0.0.1:16686 -> 16686
Conclusion
Configurations like Ingress, ClusterIssuer and OpenTelemetryCollector on
client and server side have to be configured manually. Depending on installed
Kubernetes components, the configurations differ a lot. Overall the
configuration is very error-prone. In the future the exposing of the collector
should be simplified with the help of the OpenTelemetry operator. If you are
interested in the development, you can follow
GitHub issue #902
to stay updated.