Distributed tracing in Knative
Blog posts are not updated after publication. This post is more than a year old, so its content may be outdated, and some links may be invalid. Cross-verify any information before relying on it.
In this article, you will learn how distributed tracing works in Knative and we will explore how the OpenTelemetry project can make tracing support in this environment easier. We will explore Knative under the hood to understand what distributed tracing capabilities it provides out-of-the-box and which parts of the system need additional instrumentation.
About Knative
Knative is a serverless platform built on top of Kubernetes as a set of
CustomResourceDefinitions (CRDs). The project is split into two logical parts:
- serving - facilitates the creation, deployment and scaling of workload/services
- eventing - facilitates event-driven communication between workloads to enable loosely coupled architectures
In this article we will not cover Knative fundamentals, please refer to the Knative documentation to get familiar with the project.
Knative data flow
Before we deep dive into tracing let’s take a look at a data flow example. It will help us to understand Knative architecture and which parts of the system need to be instrumented in order to understand the timing characteristics of the request or transaction. On the diagram below there are two user workloads (first and second) and an incoming request marked as (1. HTTP) that goes to use workload first and then to the workload second as a cloud event message.
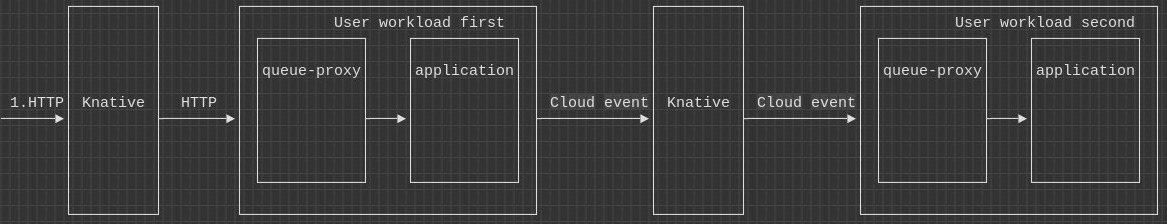
There are two important facts about this diagram:
- all the traffic goes through queue-proxy sidecar
- all traffic goes through Knative component(s). The Knative components in the diagram are abstract. It can be a Knative activator service, Knative event broker, dispatcher etc.
From the telemetry perspective, the purpose of queue-proxy is similar to istio-proxy from Istio service mesh. It is a proxy that intercepts all traffic going to the workload and it emits telemetry data for any communication going to or from the workload.
Distributed tracing in Knative
The Knative project comes with a solid distributed tracing integration. Major parts of the system are already instrumented and the system creates trace data for transactions/requests that go to user workloads.
Internally at the moment, Knative uses OpenCensus instrumentation libraries that export data in Zipkin format. The inter-process context propagation uses Zipkin B3 and W3C Trace-Context standards. The Zipkin B3 propagation format is most likely used for legacy reasons to allow trace context propagation with older workloads instrumented with older technology. As a best practice, use the standard W3C Trace-Context which is natively used by the OpenTelemetry project.
Now let’s take a look at an example trace with two workloads (first and second). The workflow is similar to the diagram from the previous section: the first service receives an HTTP call and sends a cloud event to the second service. The full demo source code can be found in pavolloffay/knative-tracing.
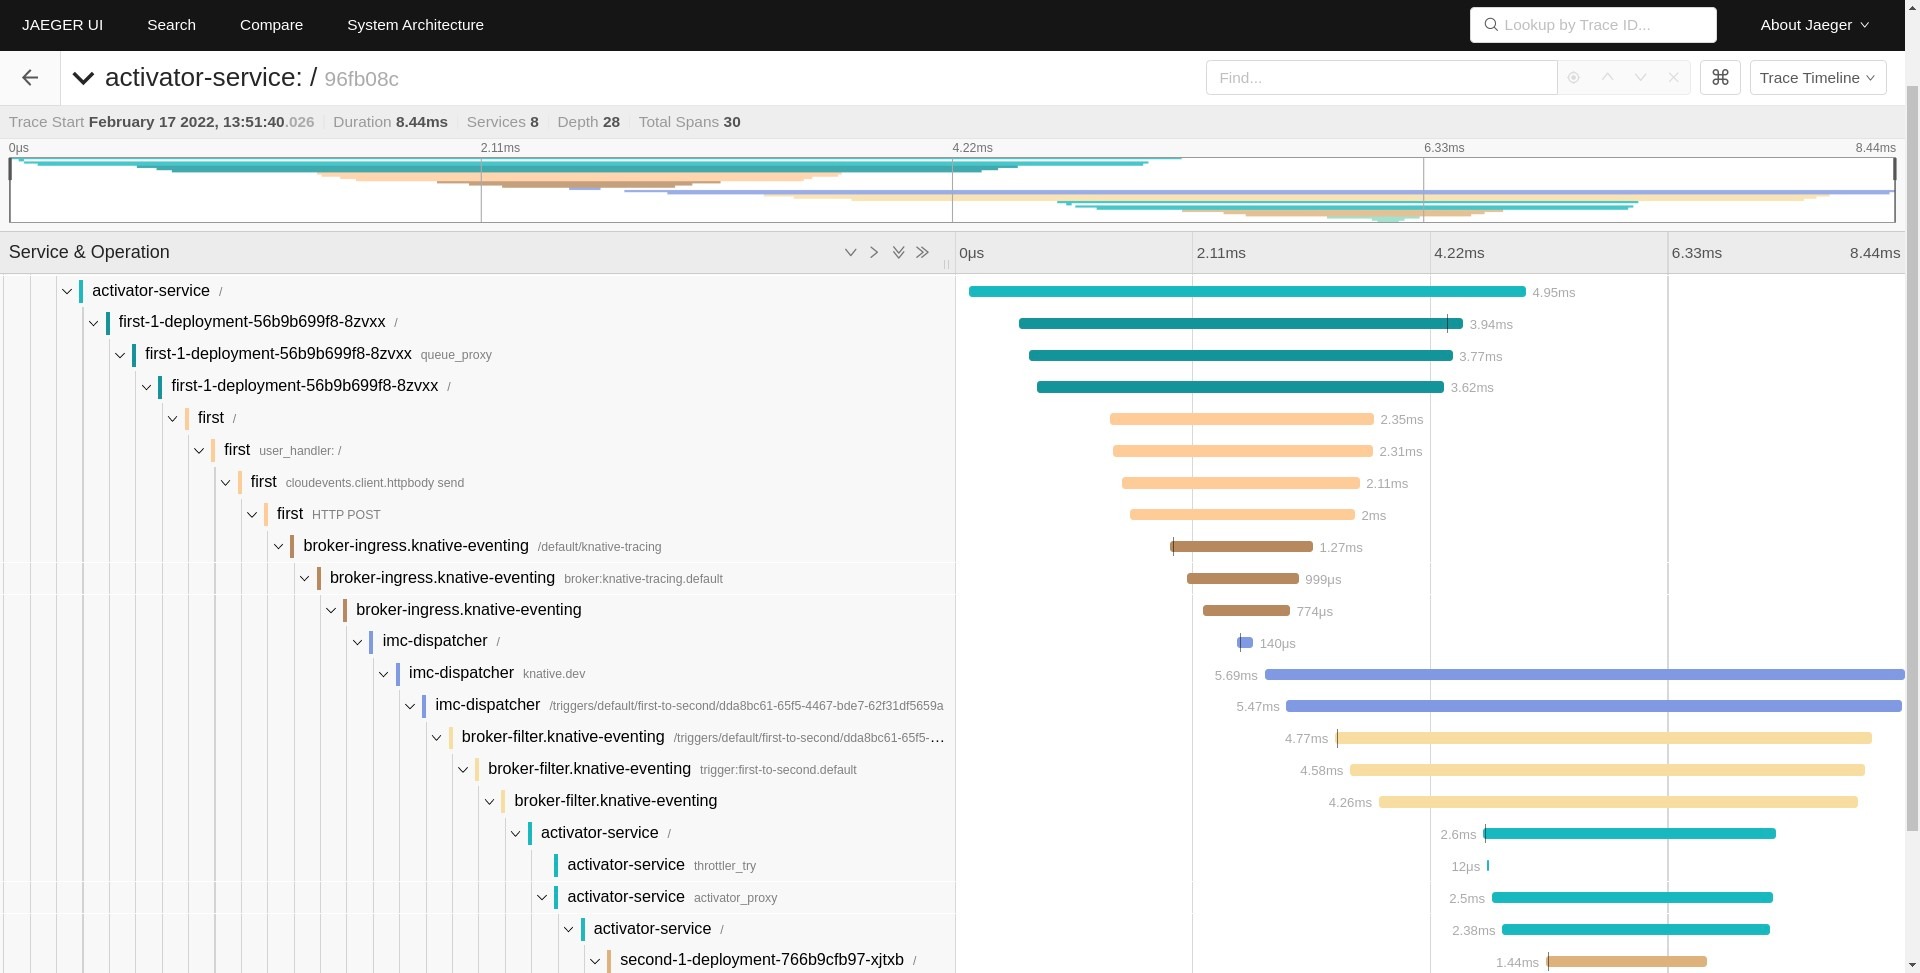
The trace shows the following services interacting: activator, first workload, broker-ingress, imc-dispatcher, broker-filter, activator, and second workload. There are many services, right? A simple interaction of two workloads resulted in a trace that shows many Knative internal components. From the observability perspective, this is great because it can show issues in the infrastructure and additionally show cost associated with Knative request processing.
Let’s briefly example the data flow. The incoming HTTP request first goes through an activator service that is responsible for scaling up a workload, then its execution reaches the first workload. The first workload sends a cloud event which goes through the broker and dispatcher and finally reaches the second workload.
Now let’s take a closer look at the user workloads. The first service is a Golang service with a single REST API endpoint. The endpoint implementation creates a cloud event and sends it to the broker. Let’s take a look at important facts from the observability perspective:
- REST API is instrumented with OpenTelemetry. This allows us to link traces started in the Knative activator service with spans created in the workload and further link it with outbound spans - e.g. to calls to the second service.
- The workload is using instrumented Cloudevents client/SDK - similarly to the previous point it allows us to continue the trace in the outbound request (in this scenario to the second service).
How is the trace-context (traceId, spanId, sampled flag) being propagated
in our example applications? The trace-context is propagated in HTTP headers
both for incoming HTTP requests into the first service and as well for cloud
events sent to the second service. The trace-context is not attached directly to
the event extensions/attributes.
Follows log output with request headers from the first service:
2022/02/17 12:53:48 Request headers:
2022/02/17 12:53:48 	X-B3-Sampled: [1]
2022/02/17 12:53:48 	X-B3-Spanid: [af6c239eb7b39349]
2022/02/17 12:53:48 	X-B3-Traceid: [5f2c4775e0e36efc1d554a0b6c456cc1]
2022/02/17 12:53:48 	X-Forwarded-For: [10.244.0.12, 10.244.0.5]
2022/02/17 12:53:48 	Accept-Language: [en,fr;q=0.9,de;q=0.8,sk;q=0.7]
2022/02/17 12:53:48 	Cookie: [_ga=GA1.2.260863911.1644918876]
2022/02/17 12:53:48 	Accept: [text/html,application/xhtml+xml,application/xml;q=0.9,image/avif,image/webp,image/apng,*/*;q=0.8,application/signed-exchange;v=b3;q=0.9]
2022/02/17 12:53:48 	K-Proxy-Request: [activator]
2022/02/17 12:53:48 	Upgrade-Insecure-Requests: [1]
2022/02/17 12:53:48 	User-Agent: [Mozilla/5.0 (X11; Fedora; Linux x86_64) AppleWebKit/537.36 (KHTML, like Gecko) Chrome/98.0.4758.80 Safari/537.36]
2022/02/17 12:53:48 	X-Request-Id: [ee2797b5-1ee9-408e-b1ff-d5e5431977e6]
2022/02/17 12:53:48 	Cache-Control: [max-age=0]
2022/02/17 12:53:48 	X-Forwarded-Proto: [http]
2022/02/17 12:53:48 	Traceparent: [00-5f2c4775e0e36efc1d554a0b6c456cc1-af6c239eb7b39349-01]
2022/02/17 12:53:48 	Accept-Encoding: [gzip, deflate]
2022/02/17 12:53:48 	Forwarded: [for=10.244.0.12;proto=http]
2022/02/17 12:53:48 Response headers:
2022/02/17 12:53:48 	Traceparent: [00-5f2c4775e0e36efc1d554a0b6c456cc1-1cf3f827eba96bf2-01]
2022/02/17 12:53:48
Now let’s take a look at logging from the second service which exposes API to consume Knative events. The event API in this case is just an HTTP endpoint which is a cloud event implementation detail:
2022/02/17 13:39:36 Event received: Context Attributes,
  specversion: 1.0
  type: httpbody
  source: github/com/pavolloffay
  id: fad4139c-b3fb-48b2-b0f4-fee44addc5f1
  time: 2022-02-17T13:39:34.426355726Z
  datacontenttype: text/plain
Extensions,
  knativearrivaltime: 2022-02-17T13:39:34.491325425Z
Data,
  hello from first, traceid=5f2c4775e0e36efc1d554a0b6c456cc1
We see that the trace context is not directly present in the event object. However, it is encoded in the incoming transport message - HTTP headers.
Future improvements
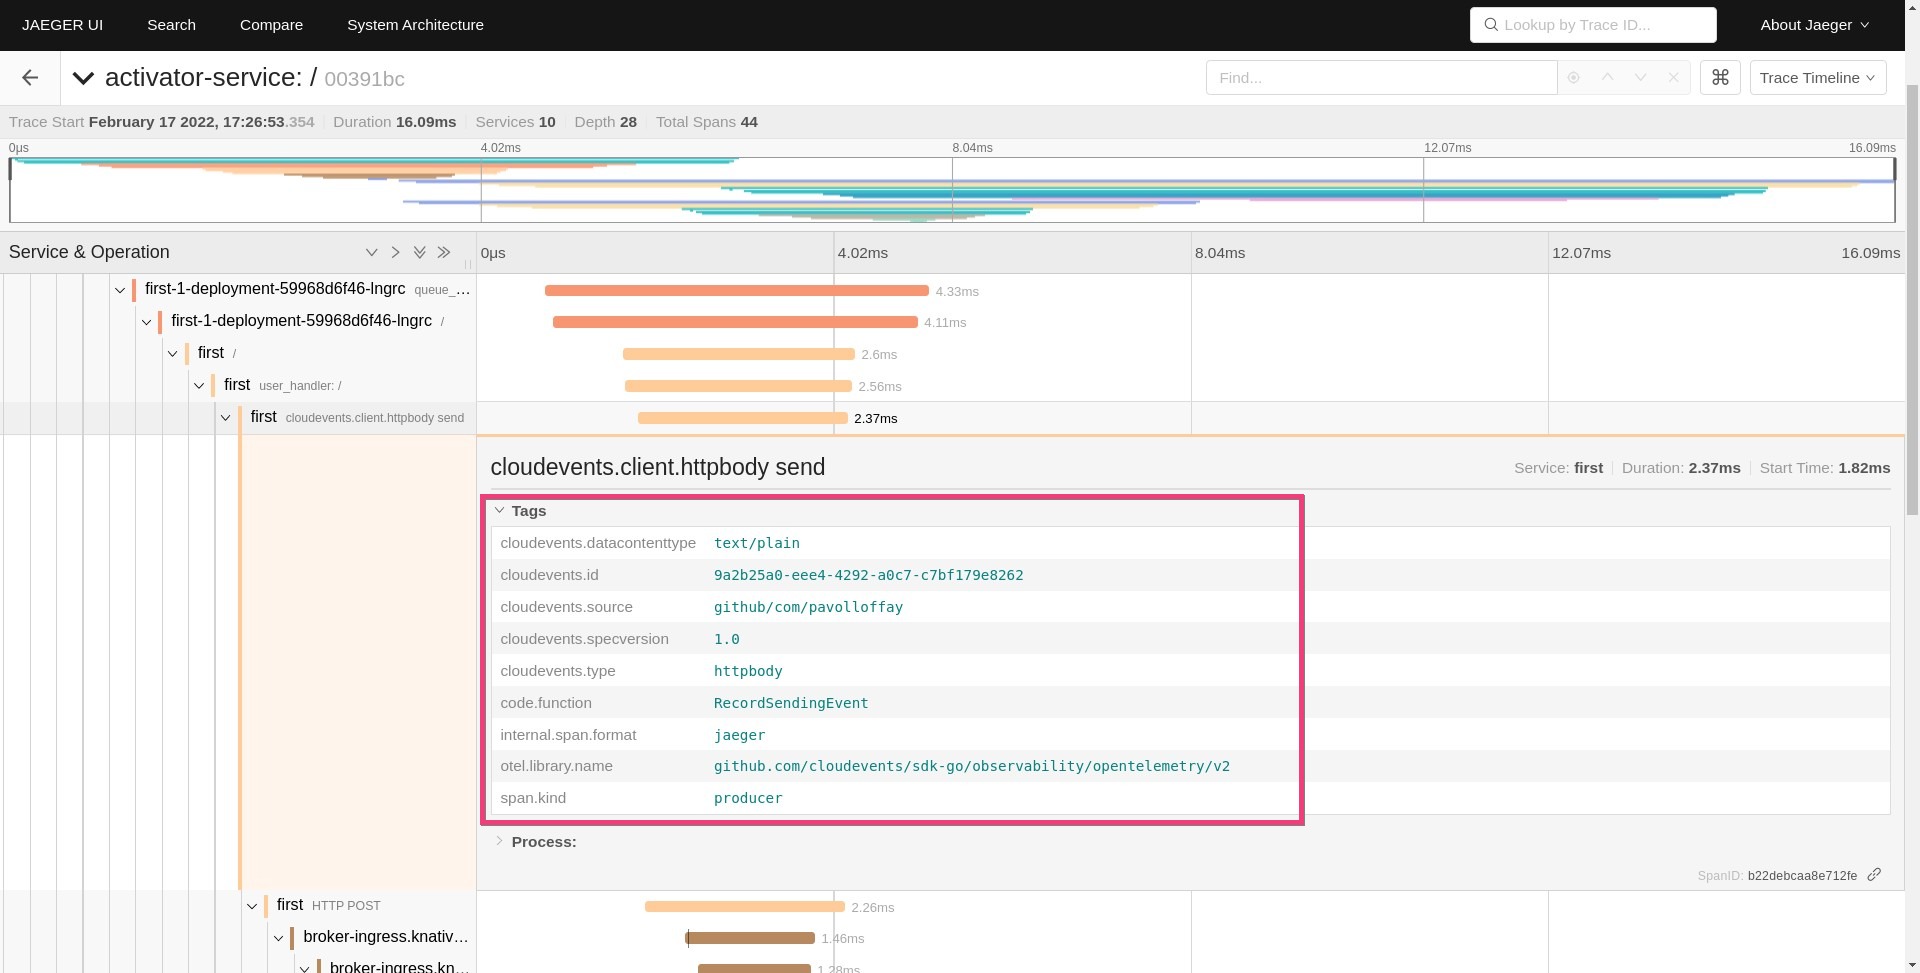
In the previous section, it was mentioned that the Knative serving and eventing components are instrumented with OpenCensus SDK. The instrumentation will change in the future to OpenTelemetry which is tracked in knative/eventing/#3126 and knative/pkg#855. The SDK change might not have an immediate impact on the user, however, it will enable users to start natively reporting data in OpenTelemetry format (OTLP).
Another recently merged change is the addition of Cloudevents semantic attributes into the OpenTelemetry specification. The document standardizes attributes related to CloudEvents. The screenshot below is from the demo application that is still not using the standardized attribute names:
Configuration
Tracing in Knative can be easily enabled. Please follow the official documentation for a step-by-step guide. Let’s briefly describe the process here:
- Deploy a tracing system that can ingest tracing data in Zipkin format - Zipkin, Jaeger, or OpenTelemetry Collector
- Enable tracing in Knative eventing
- Enable tracing in Knative serving
In the beginning, I recommended using 100% sampling rate configuration to capture trace data for all traffic in the cluster. This will help to avoid any issues with sampling, do not forget to change this configuration once moving to the production environment.
Conclusion
We have learned what distributed tracing capabilities Knative project provides out-of-the-box and which parts need more work from the user. Generally speaking Knative emits rich tracing data, however, as always the user is responsible to instrument the workload and make sure trace-context is propagated from inbound to outbound requests or events. This is exactly the same situation as implementing distributed tracing in service meshes.
OpenTelemetry can help to instrument the user workload and correctly propagate the trace-context. Depending on the language, the user can initialize instrumentation libraries explicitly in the code or even dynamically inject OpenTelemetry auto-instrumentation into the workload.