Using OpenTelemetry OpAMP to modify service telemetry on the go
Blog posts are not updated after publication. This post is more than a year old, so its content may be outdated, and some links may be invalid. Cross-verify any information before relying on it.
How verbose should your service telemetry be? Should a service output all traces, metrics, and logs 100% of the time? How much of the service traffic should be sampled? I would like to suggest the answer of “it depends”. Desired telemetry data differs in a service lifecycle from development to continuous deployment. It changes when clients face an error or a service has been thrown into a major scale.
It is possible to change a service telemetry configuration or sampling rate. Usually, it requires only a minimal code change and a deployment process. It might not seem a lot, but whenever facing a change like this across an entire system, we tend to avoid it. Instead, it is common to collect as much data as possible, which causes an issue by itself. Can we dynamically modify service telemetry without those barriers? Thanks to OpAMP protocol and the people behind it, I believe that the answer is about to change.
OpAMP stands for Open Agent Management Protocol. It aims at managing large fleets of data collection agents, and its GoLang implementation is at the Beta stage. It allows configuration changes as well as package downloads. It defines the communication between the OpAMP server and OpAMP client but does not assume any particular client-agent relationship giving it a lot of flexibility.
In the following example, we’ll create a simple GoLang server, instrument it, and then control it with an OpAMP server and supervisor. We won’t dive into OpAMP implementation itself, but rather focus on its implications using these examples.
First, consider this basic go server:
package main

import (
	"fmt"
	"log"
	"net/http"
)

func httpHandler(w http.ResponseWriter, r *http.Request) {
	fmt.Fprintf(w, "Hi! This action could create a trace!")
}

func main() {
	handler := http.HandlerFunc(httpHandler)
	http.Handle("/", handler)
	fmt.Println("Starting server on port 8080")
	log.Fatal(http.ListenAndServe(":8080", nil))
}
Next, add a basic configuration file named effective.yaml. Place it in the
same folder as our main.go file with this configuration:
instrument: false
Let’s add a basic configuration handler to our server:
package main

import (
   "fmt"
   "gopkg.in/yaml.v3"
   "io/ioutil"
   "log"
   "net/http"
   "path/filepath"
)

type configurations struct {
   Instrument bool
}

func httpHandler(w http.ResponseWriter, r *http.Request) {
   fmt.Fprintf(w, "Hi! This action could create a trace!")
}

func main() {
   filename, _ := filepath.Abs("./effective.yaml")
   yamlFile, _ := ioutil.ReadFile(filename)

   var config configurations
   yaml.Unmarshal(yamlFile, &config)

   handler := http.HandlerFunc(httpHandler)
   http.Handle("/", handler)
   fmt.Println("Starting server on port 8080")
   log.Fatal(http.ListenAndServe(":8080", nil))
}
Next, let’s wrap our handler with instrumentation and condition it with our configuration file. Something like this:
package main

import (
   "context"
   "fmt"
   "go.opentelemetry.io/contrib/instrumentation/net/http/otelhttp"
   "go.opentelemetry.io/otel"
   "go.opentelemetry.io/otel/exporters/stdout/stdouttrace"
   sdktrace "go.opentelemetry.io/otel/sdk/trace"
   "go.opentelemetry.io/otel/trace"
   "gopkg.in/yaml.v3"
   "io/ioutil"
   "log"
   "net/http"
   "os"
   "path/filepath"
)

type configurations struct {
   Instrument bool
}

var tracer trace.Tracer

func newConsoleExporter() (sdktrace.SpanExporter, error) {
   return stdouttrace.New(
      stdouttrace.WithWriter(os.Stdout),
      stdouttrace.WithPrettyPrint(),
   )
}

func httpHandler(w http.ResponseWriter, r *http.Request) {
   fmt.Fprintf(w, "Hi! This action could create a trace!")
}

func setHandler(handler http.Handler, config configurations) http.Handler {
   if config.Instrument {
      return otelhttp.NewHandler(handler, "instrumentation activated by OpAMP")
   }
   return http.HandlerFunc(httpHandler)
}

func main() {
   filename, _ := filepath.Abs("./effective.yaml")
   yamlFile, _ := ioutil.ReadFile(filename)

   var config configurations
   yaml.Unmarshal(yamlFile, &config)

   exp, _ := newConsoleExporter()
   tp := sdktrace.NewTracerProvider(sdktrace.WithBatcher(exp))
   defer func() { _ = tp.Shutdown(context.Background()) }()

   otel.SetTracerProvider(tp)

   tracer = tp.Tracer("ControlledOpAMPAgentDemo")
   handler := http.HandlerFunc(httpHandler)
   http.Handle("/", setHandler(handler, config))
   fmt.Println("Starting server on port 8080")
   log.Fatal(http.ListenAndServe(":8080", nil))
}
Build and run this app:
go build .
go run .
Open a browser and visit http://localhost:8080. Nothing special will be shown. It’s time to add some OpAMP. Git clone opamp-go and run the server with:
cd internal/examples/server
go run .
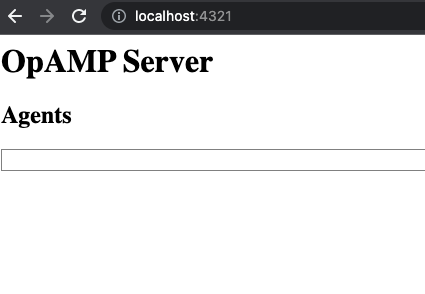
Visit http://localhost:4321 to verify that the server is running. Notice that no agent is displayed:
Next, edit internal/examples/supervisor/bin/supervisor.yaml to point at our agent. It should look like this:
server:
  endpoint: ws://127.0.0.1:4320/v1/opamp
agent:
  executable: <absolute|relative path to previous build>
Then open a new terminal and run the following command:
cd internal/examples/supervisor/bin
go build -o ./supervisor ../main.go
./supervisor
We have now a system consisting of OpAMP server supervisor and our server
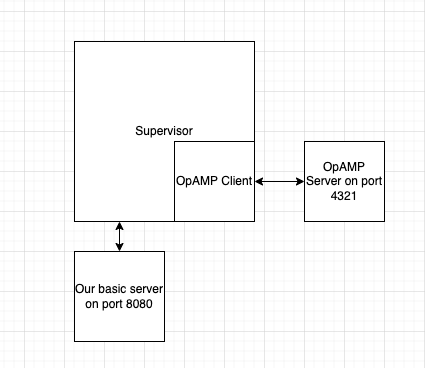
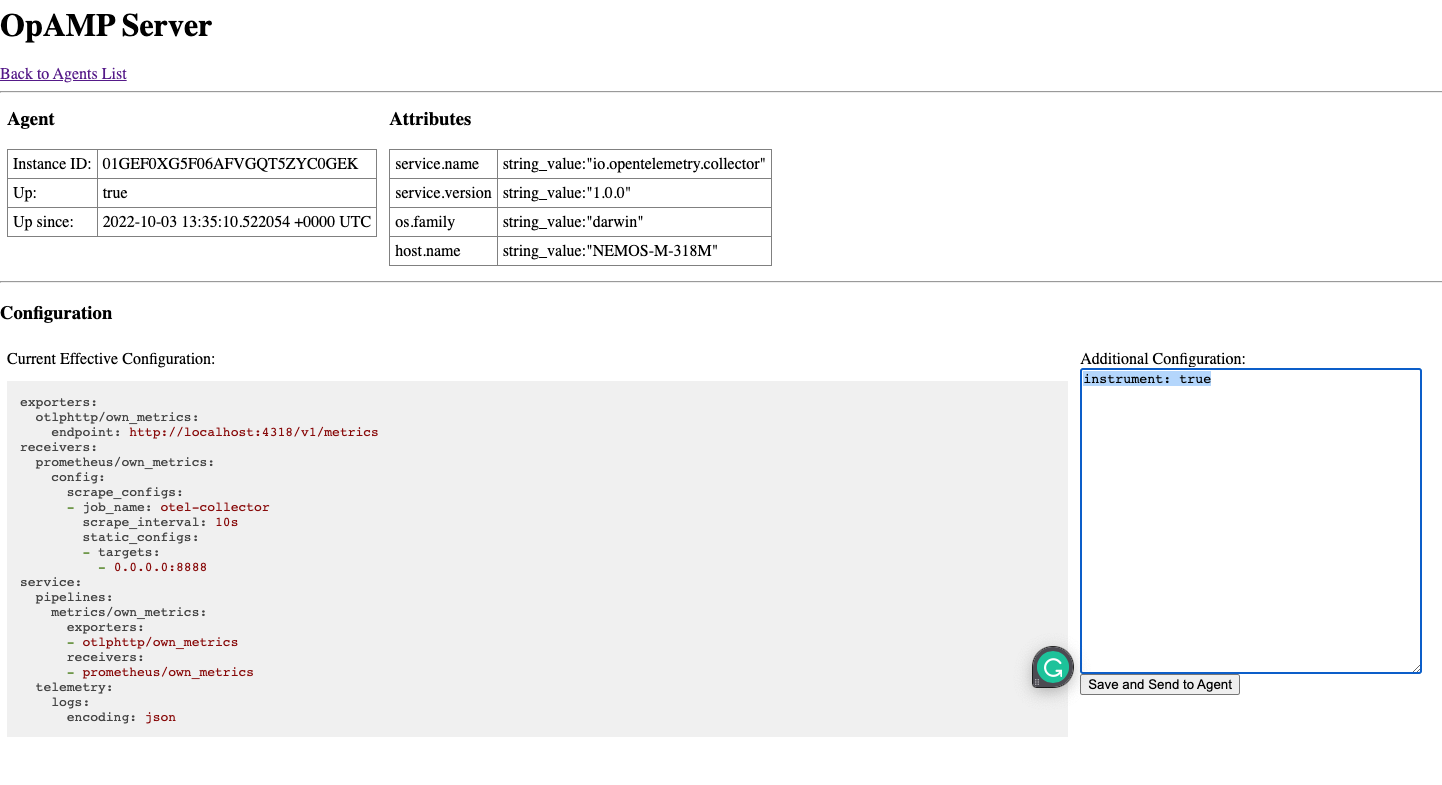
Via the supervisor we can now see our agent running at http://localhost:4321.
Select it and pass instrument: true to its configurations.
You can see the changes over the supervisor console log:
Received remote config from server, hash=0008886301f3ccb3520216823cfa09a.
Effective config changed.
Config is changed. Signal to restart the agent.
Restarting the agent with the new config.
Stopping agent process, PID=19206
Agent process PID=19206 successfully stopped.
Starting agent <agent path>
Agent process started, PID=19506
Finally, visit http://localhost:8080. Traces should now appear in
internal/examples/supervisor/bin/agent.log.
Starting server on port 8080
{
   "Name": "instrumentation activated by OpAMP server",
   "SpanContext": {
      "TraceID": "d2f76958023624d4c1def3f44899b6d4",
      "SpanID": "085510f551dc31a1",
      "TraceFlags": "01",
      "TraceState": "",
      "Remote":false
   ...
These lines are the trace itself!
To sum up, we have here a server that controls whether our service will generate
traces. Try setting it off using the instrument: false configuration.
This is a very basic implementation. Wrapping a system above OpAMP could perform as an instrumentation orchestrator. The starting point is being able to externally add and match tailor-made dynamic telemetry for your system. Imagine what AI can achieve on this type of system. It could collect metrics over the entire system, automatically and dynamically adding trace/log collections onto any detected bottlenecks. Using this protocol enables many new possibilities, I believe it has the potential to change how we think about telemetry.