Gaining JMX Metric Insights with the OpenTelemetry Java Agent
Blog posts are not updated after publication. This post is more than a year old, so its content may be outdated, and some links may be invalid. Cross-verify any information before relying on it.
JMX (Java Management Extensions) is a technology that provides a way to manage and monitor Java-based applications. Detailed information about the performance and resource usage of the application can be derived from JMX metrics. This data can help you identify trends or potential issues with the application and take action to address them before they become serious problems. If there are any problems, we can diagnose them with the help of metrics collected, and fine-tune the system for optimal performance.
With the addition of the JMX Metric Insight module into the OpenTelemetry Java agent, we don’t need to deploy a separate service just to collect JMX metrics for monitoring our application. The agent can now natively collect and export metrics exposed by application servers through local MBeans available within the instrumented application. The required MBeans and corresponding metrics can be described using a YAML configuration file. The individual metric configurations allow precise metric selection and identification. JMX Metric Insight comes with a number of predefined configurations containing curated sets of JMX metrics for popular application servers or frameworks, such as:
You can also provide your own metric definitions, through one or more YAML files. For more information, see the YAML file syntax documentation.
Observe Kafka Broker metrics
Let’s observe the health of our Kafka Broker by exporting the predefined set of metrics using the JMX Metric Insight module and export it to Prometheus.
Kafka can be installed on macOS using Homebrew with the following steps:
brew install kafka
To start Zookeeper:
zookeeper-server-start /usr/local/etc/kafka/zookeeper.properties
Attach the OpenTelemetry Java instrumentation agent
Before starting the Kafka broker, attach the OpenTelemetry Java instrumentation agent to Kafka Broker by providing options in the KAFKA_OPTS environment variable. You can download the latest release of the agent.
export KAFKA_OPTS="-Dapplication.name=my-kafka-app
-Dotel.metrics.exporter=prometheus
-Dotel.exporter.prometheus.port=9464
-Dotel.service.name=my-kafka-broker
-Dotel.jmx.target.system=kafka-broker
-javaagent:/path/to/opentelemetry-javaagent.jar"
Now we can start the Kafka Broker:
kafka-server-start /usr/local/etc/kafka/server.properties
The Kafka broker should be up and running now. To test the installation, we can create a topic and use the Kafka console producer and console consumer. Create Kafka Topic:
kafka-topics --create --bootstrap-server localhost:9092 --replication-factor 1 --partitions 1 --topic my-test-topic
Start Kafka console producer to produce messages to the topic we created:
$ kafka-console-producer --broker-list localhost:9092 --topic test
>First message
>Second message
Now we will start the Kafka console consumer which will consume messages from the topic from the beginning:
$ kafka-console-consumer --bootstrap-server localhost:9092 --topic test --from-beginning
First message
Second message
If we are able to see the two messages received by the consumer, that verifies that our Kafka installation is working as expected.
Export metrics to Prometheus
The metrics can be exported by any of the supported metric exporters, to a backend of your choice. For the full list of exporters and their configuration options, see Properties: exporters.
For instance, you can export the metrics to an OTel collector using the OTLP exporter, perform some processing and then consume the metrics on a backend of your choice. In this example for the sake of simplicity, we are directly exporting the metrics to Prometheus.
We will visualize the metrics on a Grafana dashboard using Prometheus as the
data source. In this demo, we’ll deploy Prometheus on Docker. We can create a
prometheus.yml file containing this minimal configuration:
global:
  scrape_interval: 10s
  evaluation_interval: 10s

scrape_configs:
  - job_name: my-kafka-broker
    scrape_interval: 5s
    static_configs:
      - targets: [host.docker.internal:9464]
Then run the command below to deploy Prometheus on Docker:
docker run -d \
    -p 9090:9090 \
    -v path/to/prometheus.yml:/etc/prometheus/prometheus.yml \
    prom/prometheus
The Prometheus container should be running now. You can now navigate to
http://localhost:9090 and explore the Prometheus dashboard. Here we are
viewing the metric kafka_request_count_total on Prometheus.
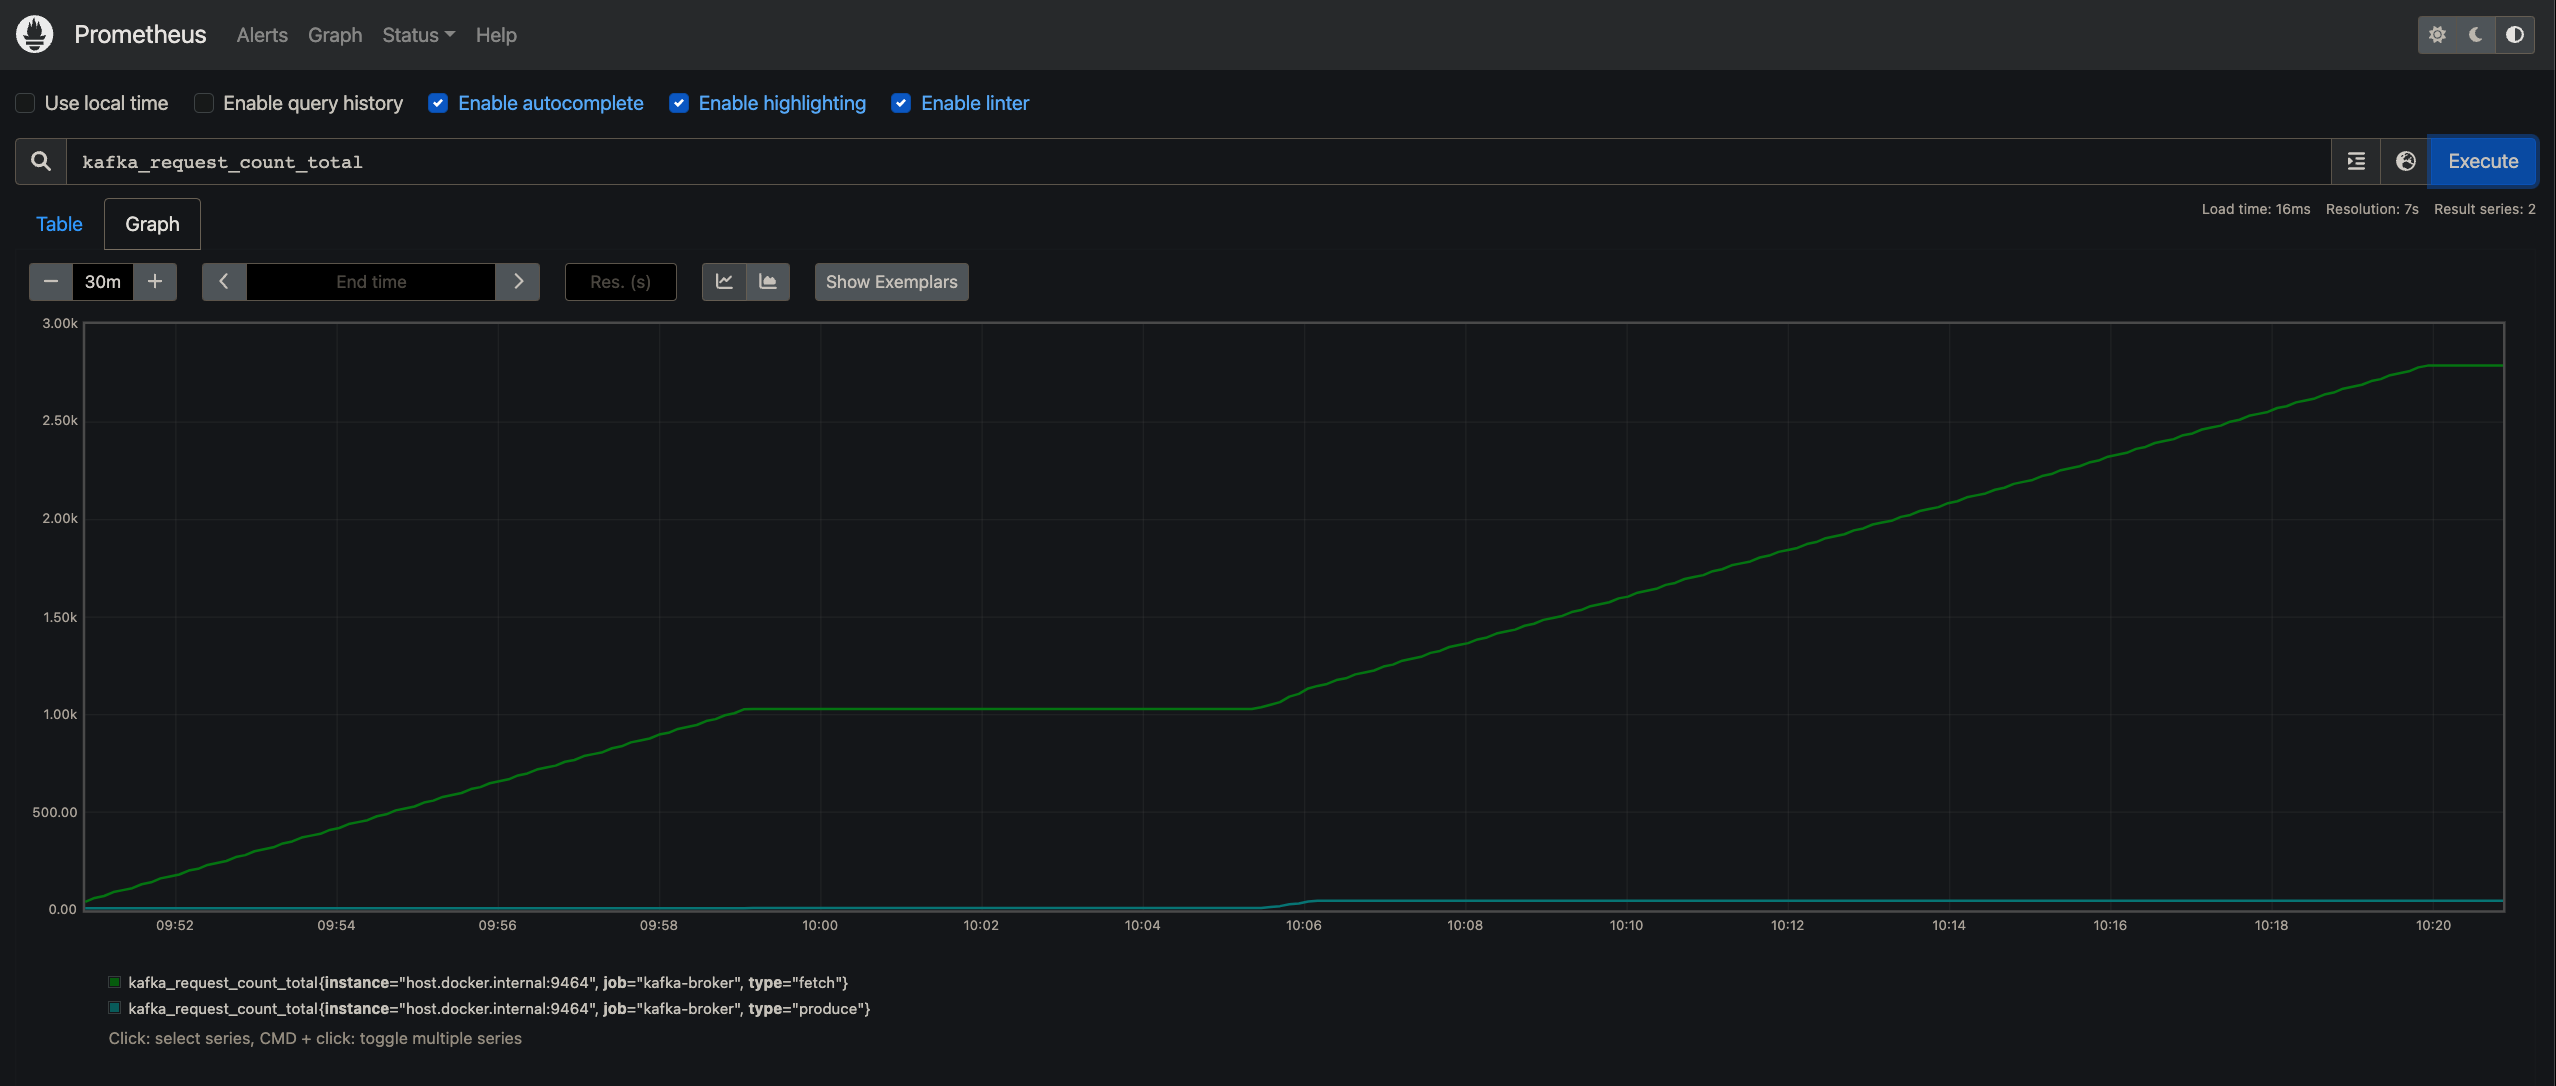
See installation options for Prometheus.
View the metrics on a Grafana Dashboard
Now, we are going to visualize the Prometheus metrics in a Grafana dashboard. To do that, first, pull the Grafana docker image using the following command:
docker run -d -p 3000:3000 grafana/grafana
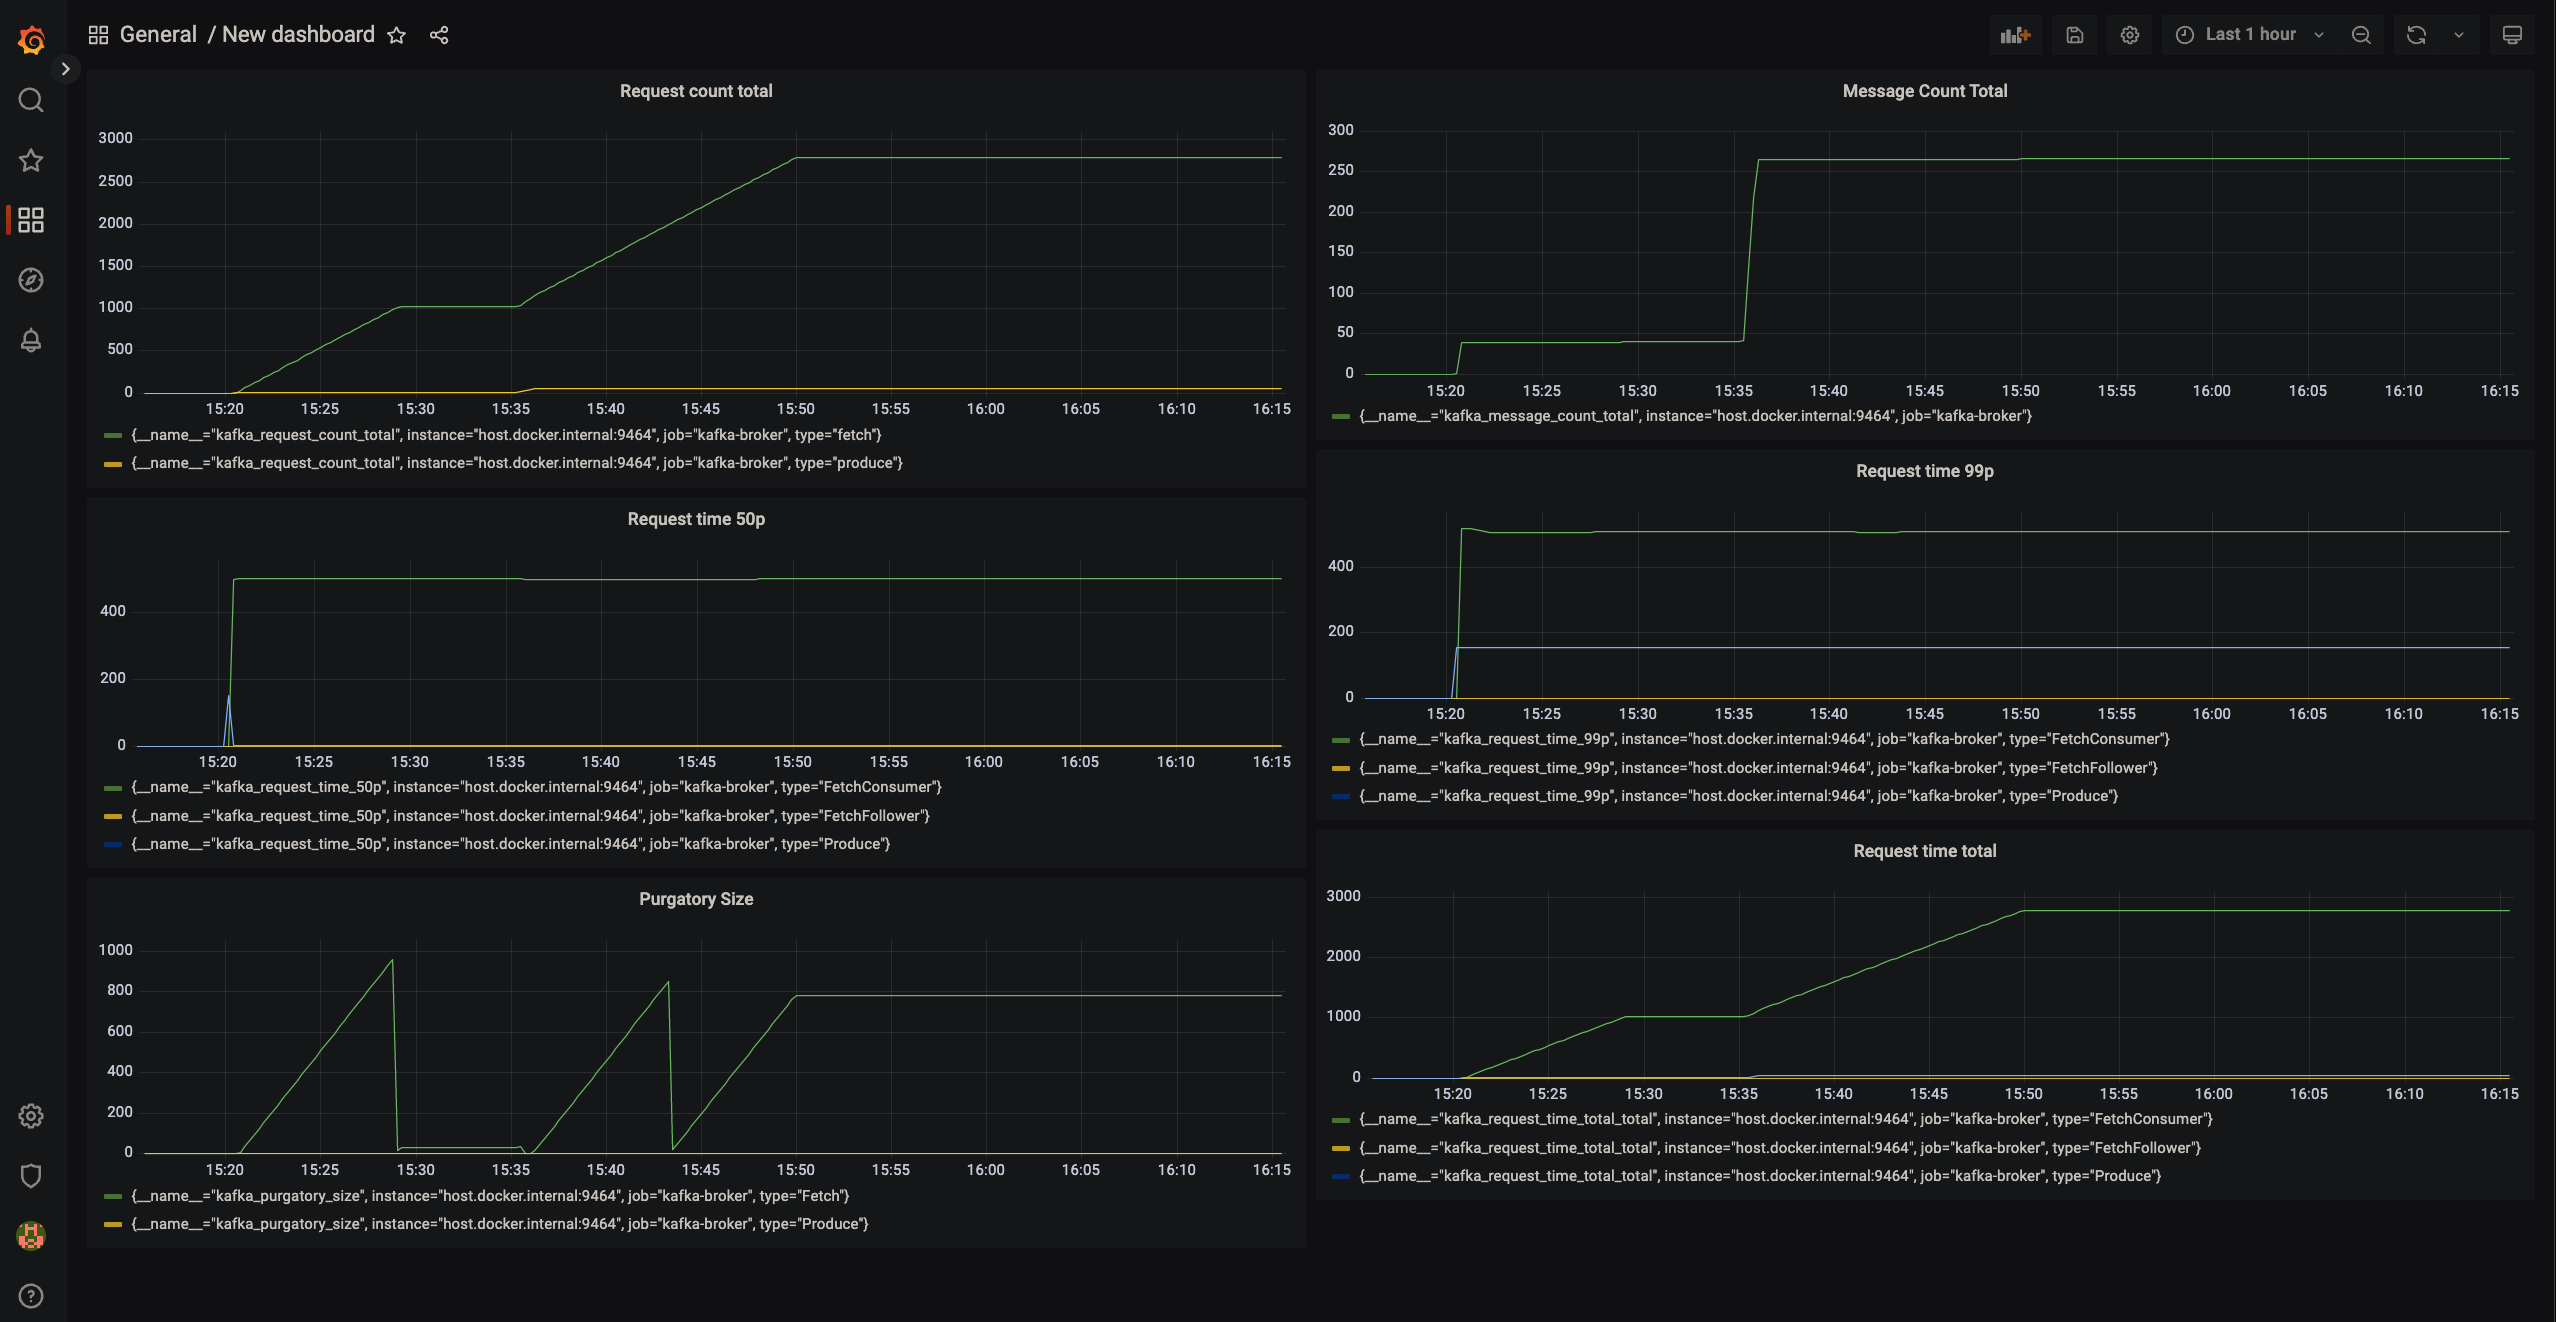
You can now navigate to http://localhost:3000 and explore the Grafana home page. Click on Add Data Source and select Prometheus. Add the HTTP URL, default is http://localhost:9090. After that we can create new Dashboards, with multiple options of visualizations to choose from (Graph, Singlestat, Gauge, Table, Text, etc). We can then create new panels and add any metric we would like to observe. Here is an example dashboard consisting of 6 panels, we are observing a metric in each panel. We can observe the health of our Kafka Broker in real time on this dashboard.
JMX Metric Insight in the OTel demo application
You can also explore the official OpenTelemetry Astronomy shop demo application. The message queue service which connects the checkout service with the accounting and fraud detection services is based on Kafka and utilizes the JMX Metric Insight module to export Kafka broker metrics out of the box. You can head to the documentation.
Further Capabilities of the module
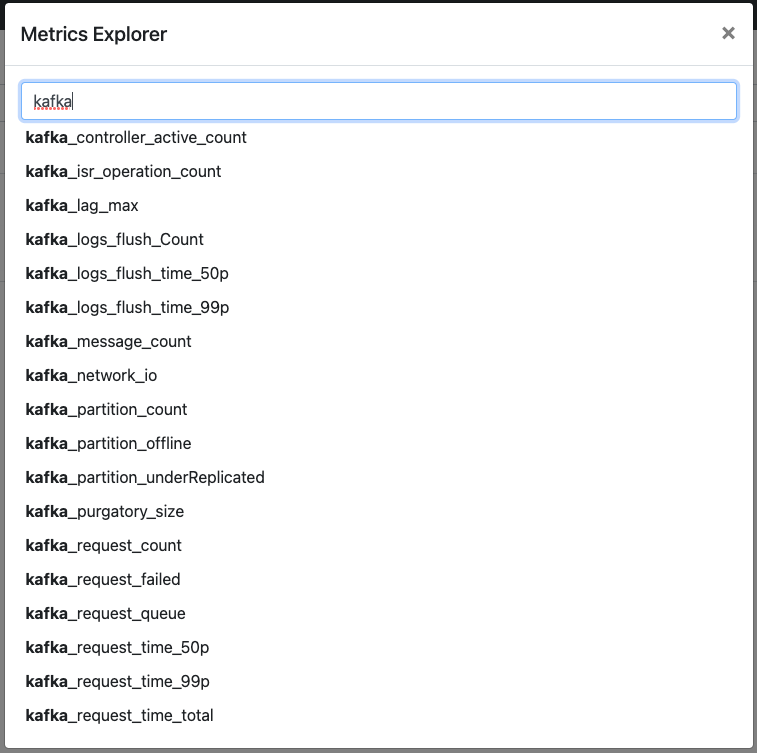
In this example, we have only observed a few metrics from the predefined set available for Kafka Broker. Not all metrics exposed by Kafka are part of the set, so if your requirement is a metric not covered in this predefined set, fret not! The module provides you with the option to create your custom metric definition yaml files, so you can observe any metric exposed as an MBean attribute. To get a peek into the structure of the yaml file, We can take a look at a segment of the kafka-broker.yaml:
---
rules:
  - bean: kafka.server:type=BrokerTopicMetrics,name=MessagesInPerSec
    mapping:
      Count:
        metric: kafka.message.count
        type: counter
        desc: The number of messages received by the broker
        unit: '{messages}'
Each file can consist of multiple rules. Each rule can identify a set of one or
more MBeans, by the object name. In this example
kafka.server:type=BrokerTopicMetrics,name=MessagesInPerSec identifies a unique
MBean. We are interested in the attribute Count of this MBean, which is
specified under mapping. The metric reported will have the name
kafka.message.count, instrument type will be counter which indicates the
metric is a monotonic sum. It’s unit will be {messages}. We have also provided
a description of the metric. This yaml segment is simple, to try out more
configuration options, you can head to the
documentation
to understand and try out all the features of the module.
Lastly, if you feel some metrics are important to be in the predefined sets of metrics, or in general if you have any idea for enhancement of the module, feel free to contribute to the repository.