Adding OpenTelemetry support to the Otterize network mapper
Blog posts are not updated after publication. This post is more than a year old, so its content may be outdated, and some links may be invalid. Cross-verify any information before relying on it.
A no-brainer integration: Adding OpenTelemetry support to the Otterize network mapper
Otterize automates workload Identity and Access Management (IAM) for zero-trust, automating policies like Kubernetes network policies, Istio policies, AWS IAM policies, and more, through a collection of open source projects. To enable that automation, Otterize built the network mapper. Otterize network mapper is a standalone Kubernetes tool that builds a live network map of your infrastructure, and can visualize it into an image file, as an interactive graph on Otterize Cloud, or export it as ClientIntents, a custom Kubernetes resource that describes each workload’s required access, or their “intentions”. It’s designed to be a zero-config deployment that immediately provides a network map, along with being light on resource use, and requiring the lowest privileges possible. At its core, it collects DNS traffic and analyzes it to figure out what communications look like.
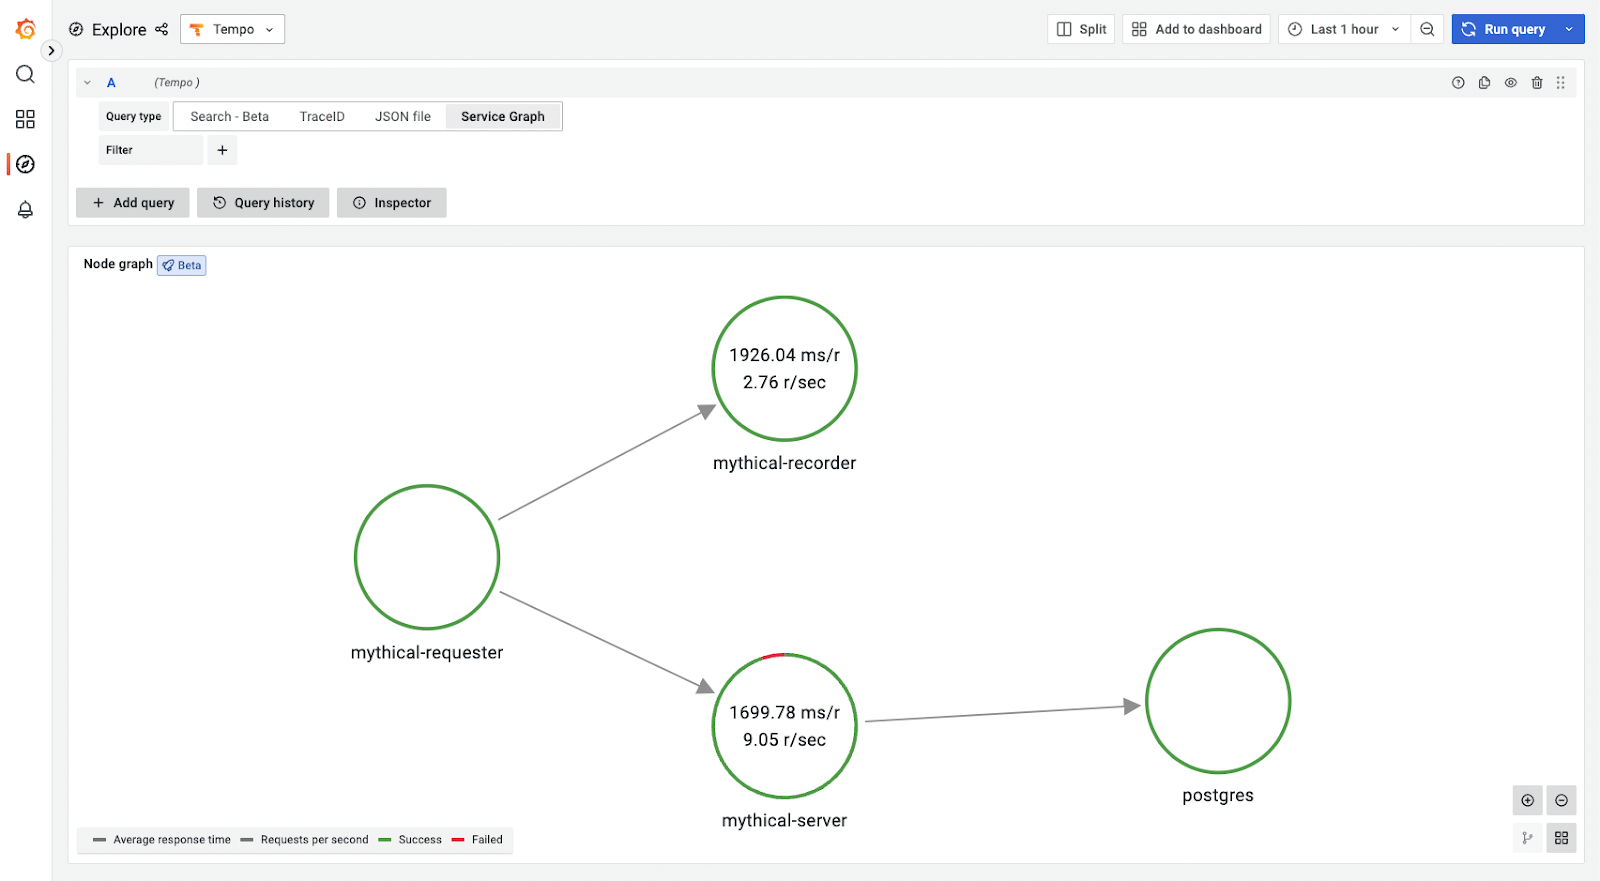
The awesome folks at ServiceNow Cloud Observability (formerly Lightstep) recently contributed OpenTelemetry exporting support to the network mapper. This means that you can now use the network mapper to generate a network map of your infrastructure, and export OpenTelemetry data to a Grafana Tempo instance, to see a service graph without making any changes to the services deployed in your cluster.
This integration was simple: the OpenTelemetry SDK is easy to use and fits like a glove into the existing network mapper code.
How does OpenTelemetry work with the network mapper?
With the service graph, you’ll be able to see what services are communicating with each other. You can then use that information for operational or security needs, such as determining the blast radius of a downtime or security incident. You can use the service graph to figure out where to start rolling out OpenTelemetry tracing, as that deployment tends to be more involved and requires the integration of the OpenTelemetry SDK into your source code.
While it was easy to use the OTel SDK for the network mapper, we can see why there’s a bit of a chicken-and-egg problem here when you’re looking into OpenTelemetry: to start seeing significant value with tracing, you really need to see a bunch of services together, and that can be a lot to do as your first step.
Since the network mapper doesn’t require you to change any of your existing application code, the barrier to entry for getting started with OpenTelemetry is significantly reduced. This is a great way to get started with emitting OpenTelemetry metrics for each service in your infrastructure and to understanding how your services interact with each other, before committing to a more significant OpenTelemetry rollout.
The strength of open source in action!
We never initially contemplated adding this feature because it didn’t cross our minds, but its value is undeniable, particularly for those deploying the network mapper and utilizing Grafana Tempo, or individuals exploring OpenTelemetry.
It’s great that the ServiceNow Cloud Observability Team stumbled upon the network mapper and graciously contributed this enhancement, making the network mapper seamlessly integrate with OpenTelemetry and Grafana. This is the beauty of open source collaboration!
If you’re interested in exploring or contributing to our project, head on over to https://github.com/otterize/network-mapper.