OTel component performance benchmarks
Blog posts are not updated after publication. This post is more than a year old, so its content may be outdated, and some links may be invalid. Cross-verify any information before relying on it.
As more and more users are looking to use OpenTelemetry instrumentation in their production deployments, one important consideration is the impact that OpenTelemetry will have on their application performance. In this blog post I will discuss a few recent improvements in tooling around performance benchmarking.
Measuring performance overhead
Instrumentation is not free. It intercepts an application’s operations and collects (often) a large amount of data, which takes additional CPU and memory. This can have a direct effect on throughput and response time, which can affect the end-user experience with the application. It can also have an impact on operational cost, such as increasing the number of instances a service runs on.
Providing general guidance about performance overhead is inherently difficult. There are many factors that affect performance: the application throughput, hardware the application runs on, what exactly is instrumented, how the OpenTelemetry SDK is configured, sampling, etc. Ultimately, the best way to measure performance is in the context of the specific application by running a load test.
With that said a number of OpenTelemetry components include performance tests that help catch regressions and can be used to provide some idea of their performance characteristics.
OpenTelemetry Collector
The OpenTelemetry Collector runs end-to-end load tests on every merge to the main branch. There have been two recent updates to the CI workflow:
- Tests run on community-owned bare metal machines, which has made test results more consistent.
- Test results are published automatically: for a subset of the load test results, see Collector Benchmarks. The complete test results are available as well.
Language SDKs
A number of OpenTelemetry SDKs already include existing micro-benchmark tests, for example:
These tests were run only on demand in the past. With the recent tooling improvements, Java and JavaScript tests are now run automatically on every merge to the main branch, and the results are published for anyone to easily access. The tests are also run on community-owned bare metal machines, so that the results are as consistent as possible.
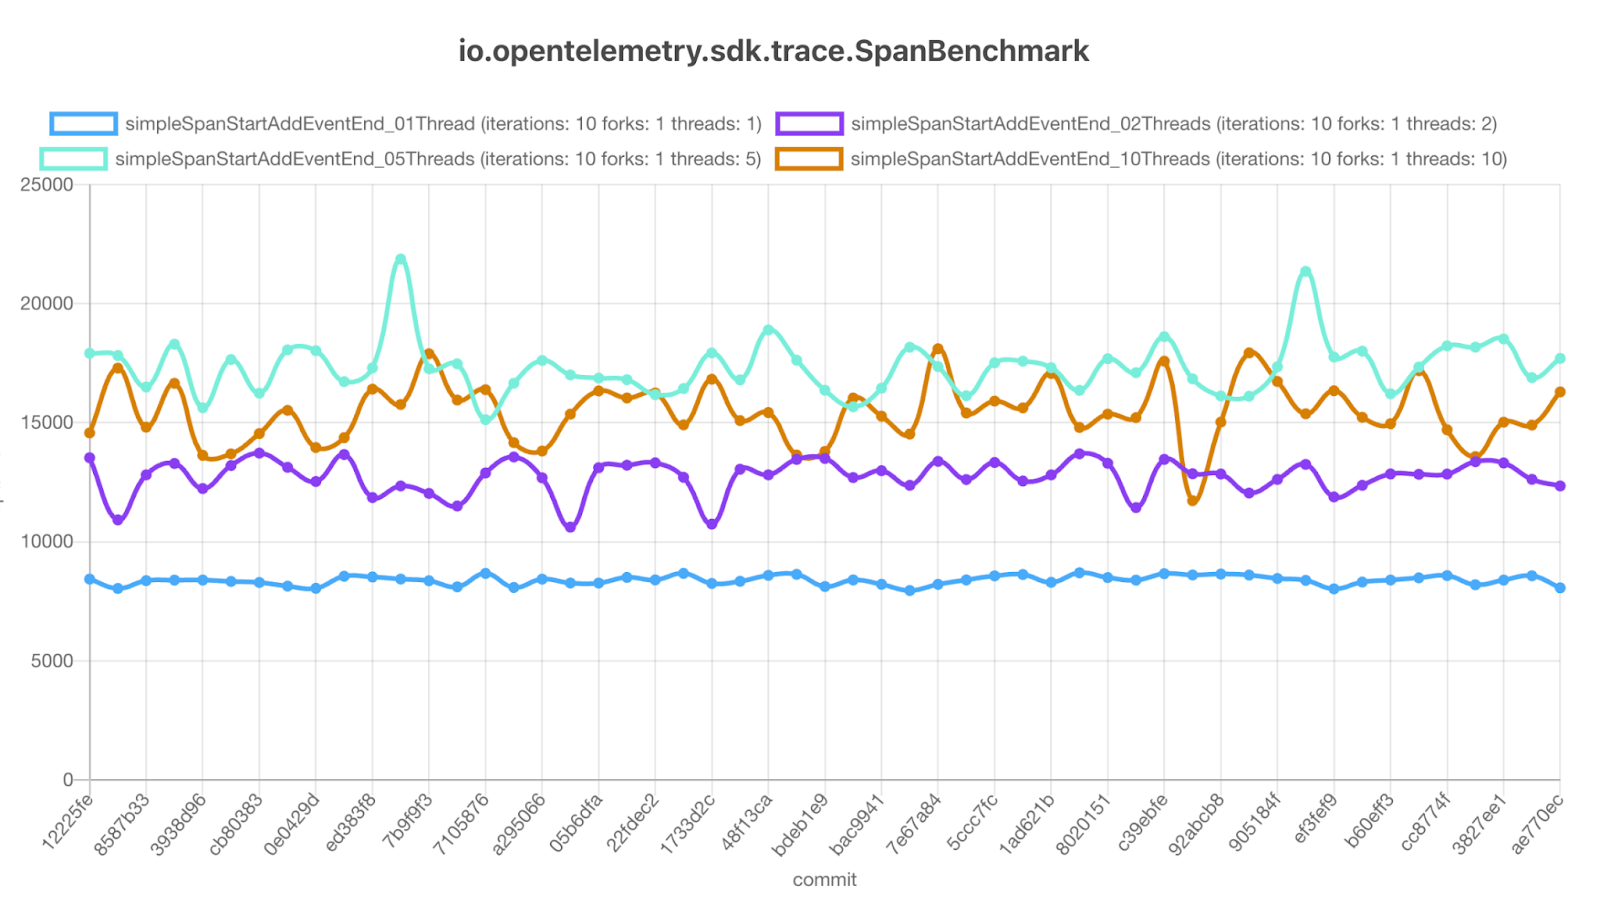
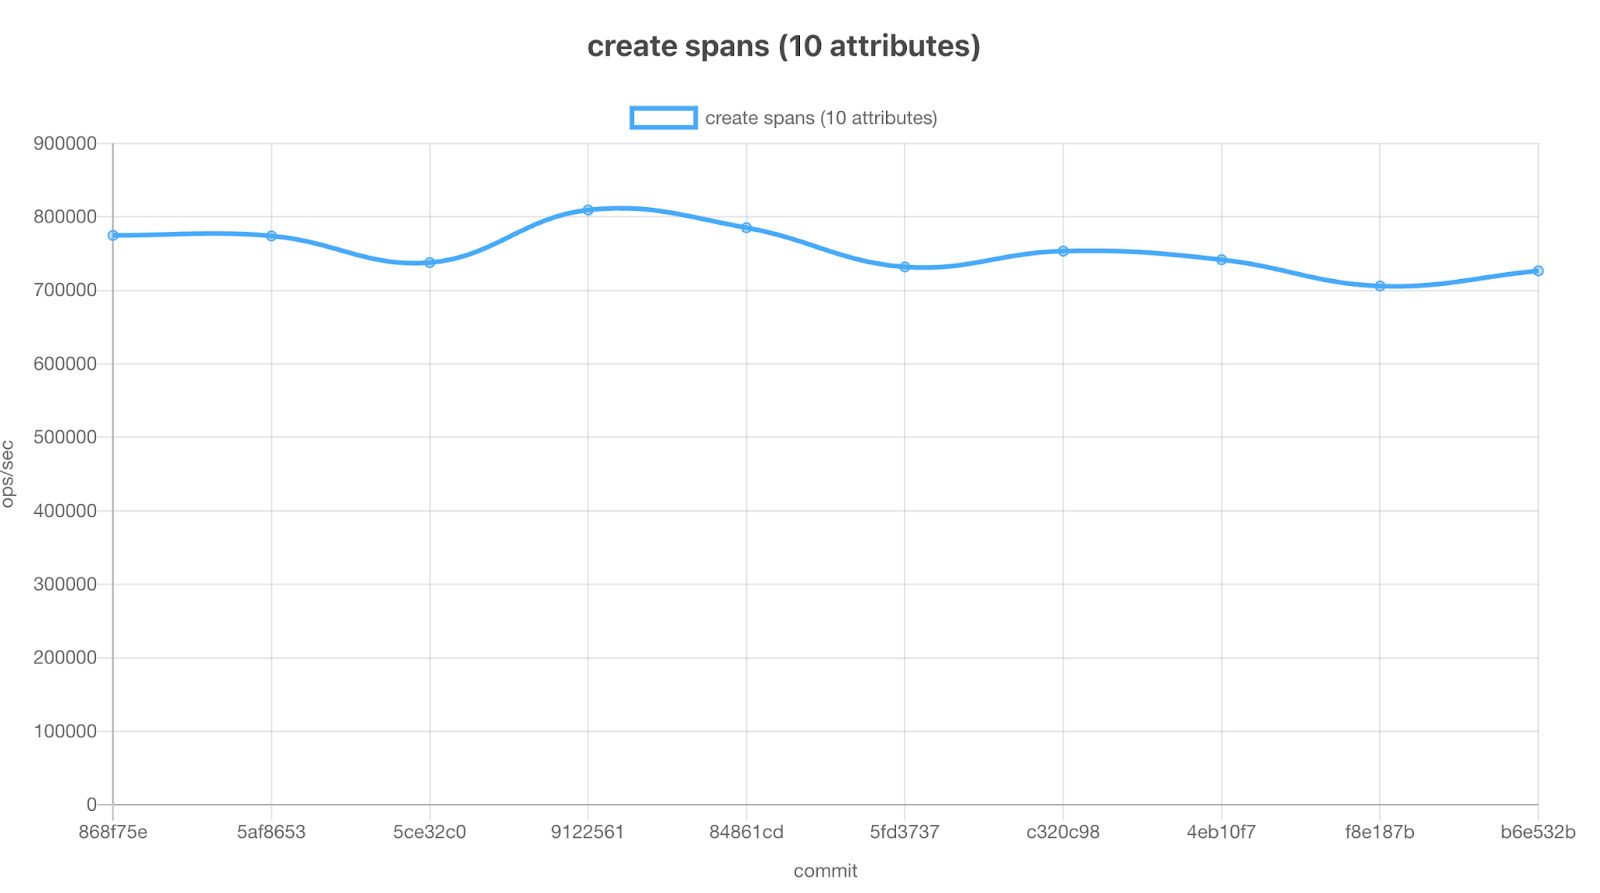
Sample benchmark results for Java
There is work in progress to make the same updates for Python and Go.
Conclusion
Performance optimization is often considered only as an afterthought, but it does not have to be. We are making improvements to automated tooling and documentation to provide project maintainers and the community with reliable performance testing during development. Ultimately our focus as a community is to give end users confidence when using our components, especially around the impact of OpenTelemetry’s instrumentation on their applications’ performance.