Getting started with otelsql, the OpenTelemetry instrumentation for Go SQL
Blog posts are not updated after publication. This post is more than a year old, so its content may be outdated, and some links may be invalid. Cross-verify any information before relying on it.
otelsql is an instrumentation library for the
database/sql library of the Go programming
language. It generates traces and metrics from the application when interacting
with databases. By doing that, the library allows you to identify errors or
slowdowns in your SQL queries that potentially impact the performance of your
application.
Let’s go dive into how to use this library!
Getting Started
otelsql is a wrapper layer for interfaces from database/sql. When users use
the wrapped database interfaces, the otelsql generates the telemetry data and
passes operations to the underlying database.
In the following example, you are going to use Docker Compose to run the otel-collector example from the otelsql repository. This example uses a MySQL client with the otelsql instrumentation. The telemetry it generates will be pushed to the OpenTelemetry Collector. Then, it shows the trace data on Jaeger and the metrics data on a Prometheus server.
Here is the data flow:
flowchart LR;
    A[MySQL client]-->B[OpenTelemetry Collector];
    B-->C["Jaeger (trace)"];
    B-->D["Prometheus (metrics)"];
Let’s clone the otelsql repository here and run the example and take a look at the most important lines of code.
git clone https://github.com/XSAM/otelsql.git
In the otelsql folder, you can also check out the git tag to v0.29.0 (the
latest tag while writing this post) to ensure the example is runnable, as the
steps to run the example might be changed in the future.
git checkout tags/v0.29.0
Let’s go to the folder of the otel-collector example and bring up all services.
cd example/otel-collector
docker compose up -d
After building images and running services, let’s check the service logs to ensure the SQL client is finished.
docker compose logs client
Then, we can access the Jaeger UI at localhost:16686 and the Prometheus UI at localhost:9090 to see the results.
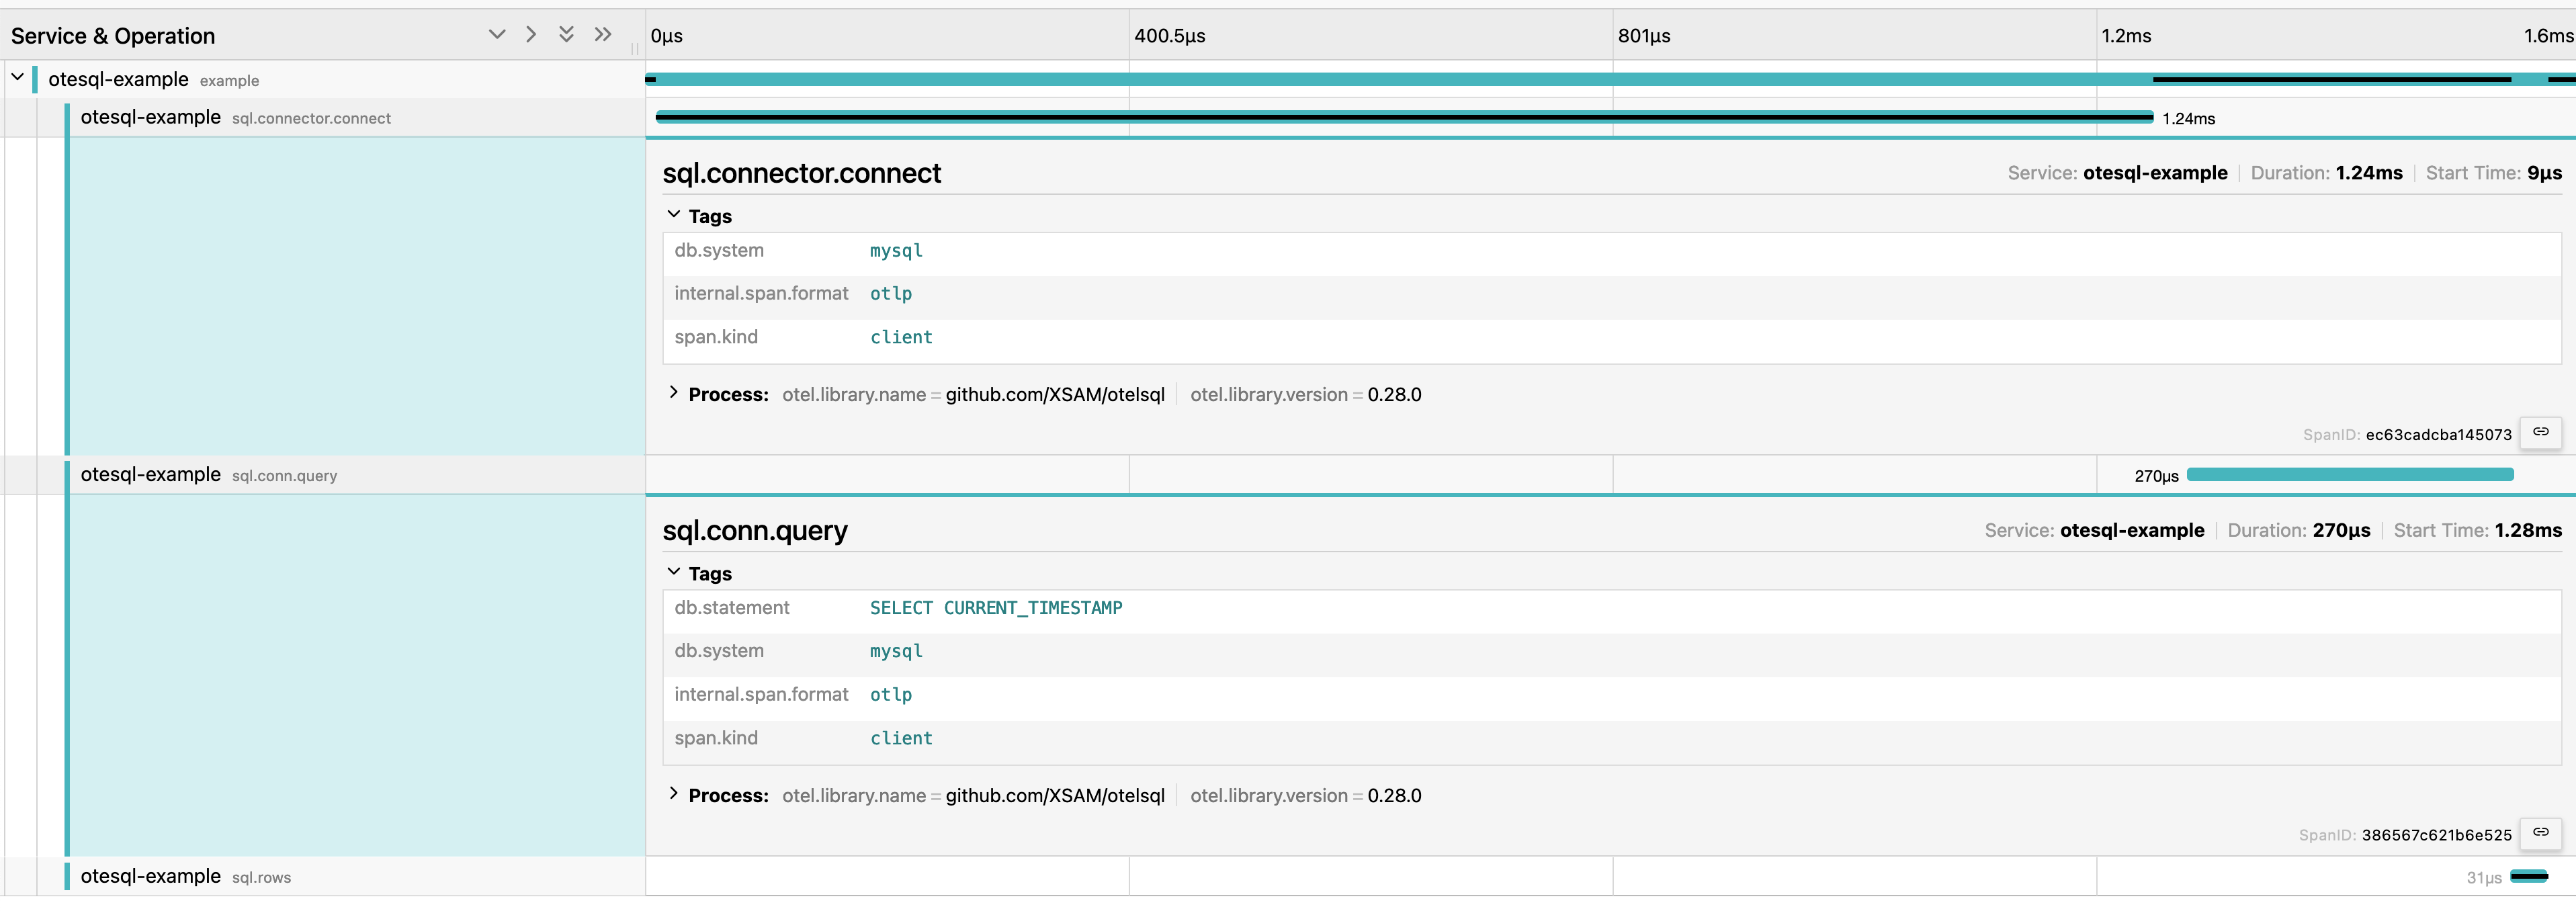
Here we are viewing a trace graph on Jaeger. We can see the duration and parameters of each operation with the database.
Here we are viewing the metric db_sql_latency_milliseconds_sum on Prometheus.
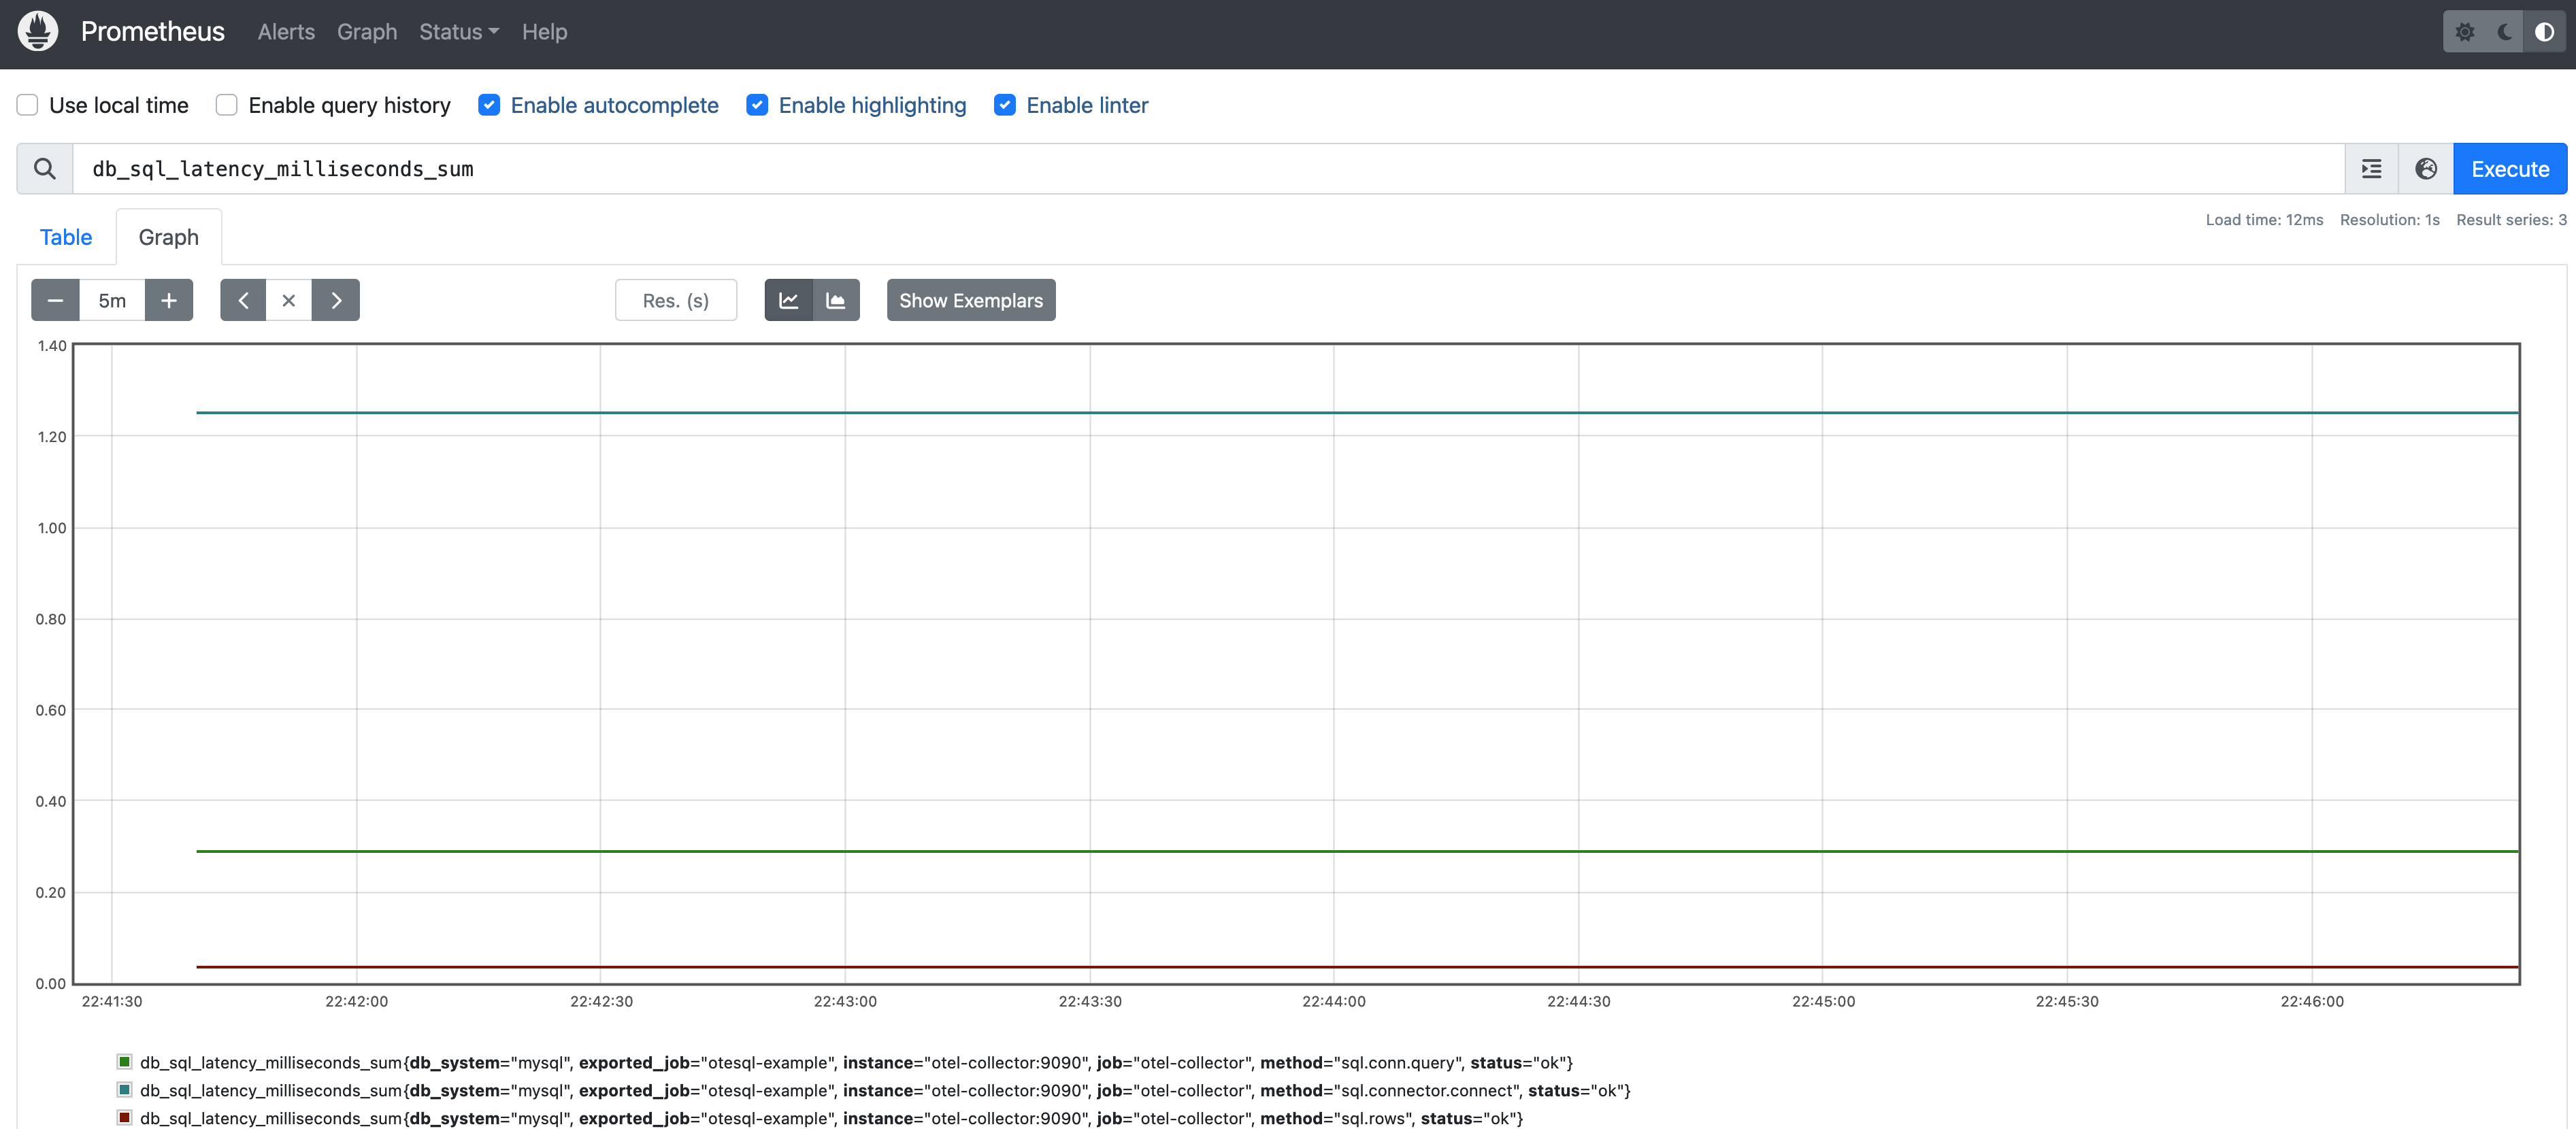
More otelsql generated metrics options can be found on the otelsql document.
Understand the example
Let’s look at the docker-compose.yaml file first.
version: '3.9'
services:
  mysql:
    image: mysql:8.3
    environment:
      - MYSQL_ROOT_PASSWORD=otel_password
      - MYSQL_DATABASE=db
    healthcheck:
      test:
        mysqladmin ping -h 127.0.0.1 -u root --password=$$MYSQL_ROOT_PASSWORD
      start_period: 5s
      interval: 5s
      timeout: 5s
      retries: 10

  otel-collector:
    image: otel/opentelemetry-collector-contrib:0.91.0
    command: ['--config=/etc/otel-collector.yaml']
    volumes:
      - ./otel-collector.yaml:/etc/otel-collector.yaml
    depends_on:
      - jaeger

  prometheus:
    image: prom/prometheus:v2.45.2
    volumes:
      - ./prometheus.yaml:/etc/prometheus/prometheus.yml
    ports:
      - 9090:9090
    depends_on:
      - otel-collector

  jaeger:
    image: jaegertracing/all-in-one:1.52
    ports:
      - 16686:16686

  client:
    build:
      dockerfile: $PWD/Dockerfile
      context: ../..
    depends_on:
      mysql:
        condition: service_healthy
This Docker compose file contains five services. The client service is the
MySQL client built from Dockerfile and the source code is main.go in the example
folder. The client service runs after the mysql service is up. Then, it
initializes the OpenTelemetry client and otelsql instrumentation, make SQL
queries to the mysql service, and send metrics and trace data to
otel-collector service through the
OpenTelemetry Protocol (OTLP).
After receiving the data, the otel-collector service transfers the data format
and send metrics data to the prometheus service, and send trace data to the
jaeger service.
Let’s check main.go to see what happens in the client service. Here is the
main function.
func main() {
	ctx, cancel := signal.NotifyContext(context.Background(), os.Interrupt)
	defer cancel()

	conn, err := initConn(ctx)
	if err != nil {
		log.Fatal(err)
	}

	shutdownTracerProvider, err := initTracerProvider(ctx, conn)
	if err != nil {
		log.Fatal(err)
	}
	defer func() {
		if err := shutdownTracerProvider(ctx); err != nil {
			log.Fatalf("failed to shutdown TracerProvider: %s", err)
		}
	}()

	shutdownMeterProvider, err := initMeterProvider(ctx, conn)
	if err != nil {
		log.Fatal(err)
	}
	defer func() {
		if err := shutdownMeterProvider(ctx); err != nil {
			log.Fatalf("failed to shutdown MeterProvider: %s", err)
		}
	}()

	db := connectDB()
	defer db.Close()

	err = runSQLQuery(ctx, db)
	if err != nil {
		log.Fatal(err)
	}

	fmt.Println("Example finished")
}
This main function is pretty straightforward. It initializes a connection with
the otel-collector service, which is used by the tracer provider and the meter
provider. Then, it configures the tracer provider and meter provider with the
connection and a shutdown method, which ensures the telemetry data can be
pushed to the otel-collector service correctly before exiting the application.
After finishing setting up the OpenTelemetry client, it invokes the connectDB
method to use the otelsql library to interact with the MySQL database. Let’s
look at the details here.
func connectDB() *sql.DB {
	// Connect to database
	db, err := otelsql.Open("mysql", mysqlDSN, otelsql.WithAttributes(
		semconv.DBSystemMySQL,
	))
	if err != nil {
		log.Fatal(err)
	}

	// Register DB stats to meter
	err = otelsql.RegisterDBStatsMetrics(db, otelsql.WithAttributes(
		semconv.DBSystemMySQL,
	))
	if err != nil {
		log.Fatal(err)
	}
	return db
}
Instead of using the sql.Open method
that Go provides, we use
otelsql.Open to create an
sql.DB instance. The sql.DB instance
returned by otelsql.Open is a wrapper that transfers and instruments all DB
operations to the underlying sql.DB instance (created by sql.Open). When
users send SQL queries with this wrapper, otelsql can see the queries and use
the OpenTelemetry client to generate telemetry.
Besides using otelsql.Open, otelsql provides three additional ways to
initialize instrumentation: otelsql.OpenDB, otelsql.Register, and
otelsql.WrapDriver. These additional methods cover different use cases, as
some database drivers or frameworks don’t provide a direct way to create
sql.DB. Sometimes, you might need these additional methods to manually create
a sql.DB and push it to those database drivers. You can check
examples on the otelsql document
to learn how to use these methods.
Moving on, we use otelsql.RegisterDBStatsMetrics to register metrics data from
sql.DBStats. The metrics recording process runs in the background and updates
the value of the metric when needed after the registration, so we don’t need to
worry about creating an individual thread for this.
After having an sql.DB wrapped by otelsql, we can use it to make queries.
func runSQLQuery(ctx context.Context, db *sql.DB) error {
// Create a parent span (Optional)
tracer := otel.GetTracerProvider()
ctx, span := tracer.Tracer(instrumentationName).Start(ctx, "example")
defer span.End()
err := query(ctx, db)
if err != nil {
span.RecordError(err)
return err
}
return nil
}
func query(ctx context.Context, db *sql.DB) error {
// Make a query
rows, err := db.QueryContext(ctx, `SELECT CURRENT_TIMESTAMP`)
if err != nil {
return err
}
defer rows.Close()
var currentTime time.Time
for rows.Next() {
err = rows.Scan(¤tTime)
if err != nil {
return err
}
}
fmt.Println(currentTime)
return nil
}
This runSQLQuery method creates a parent span first (it is an optional step,
it makes the query spans have a parent, and it looks good on the trace graph),
then queries the current timestamp from the MySQL database.
After this method, the client application finishes and exits. They are the
most important lines of code for understanding the example.
Use the example as a playground
After understanding the example, we can use it as a playground, making it a bit complicated to see how it will be used in a real-world scenario.
Use the following codes to replace the runSQLQuery method in the example.
func runSQLQuery(ctx context.Context, db *sql.DB) error {
    // Create a parent span (Optional)
    tracer := otel.GetTracerProvider()
    ctx, span := tracer.Tracer(instrumentationName).Start(ctx, "example")
    defer span.End()

    runSlowSQLQuery(ctx, db)

    err := query(ctx, db)
    if err != nil {
        span.RecordError(err)
        return err
    }
    return nil
}

func runSlowSQLQuery(ctx context.Context, db *sql.DB) {
    db.QueryContext(ctx, `SELECT SLEEP(1)`)
}
This time, we added a new query to the example, which is a slow query that would take 1 second to return. Let’s see what could happen and how to identify this slow query.
To make this change work, we need to rebuild the client service.
docker compose build client
docker compose up client
After the client is finished, we can check the trace graph for the trace we just generated on Jaeger.

From this graph, we know the entire example takes 1 second to complete. The root
cause of this slowness is not related to the network latency with the database
and the timestamp query. It is the SELECT SLEEP(1) query that leads to the
slowness.
You can also learn about the slowness from the aggregated statistics of the database by metrics. Such is the observability otelsql can provide so you can learn what your application is doing with the database.
Compatibility
You might worry about the compatibility issue with other databases and other third-party database frameworks (like ORMs) and wonder how widely this instrumentation can be used.
From an implementation perspective, as long as the database drivers or the
database frameworks interact with the database (any database, not just an SQL
database) through database/sql with context, otelsql should work just fine.
This is an example that shows how otelsql works with Facebook’s entity framework for Go.
Other cool features
Now that you’ve experienced the main feature, let’s take some time to explore
the other cool features otelsql provides.
Sqlcommenter support
otelsql integrates Sqlcommenter, an open source ORM autoinstrumentation library that merges with OpenTelemetry by injecting a comment into SQL statements to enable context propagation for the database.
Using the option WithSQLCommenter, otelsql injects a comment for every SQL
statement it instruments.
For instance, an SQL query sent to the database
SELECT * from FOO
becomes
SELECT * from FOO /*traceparent='00-4bf92f3577b34da6a3ce929d0e0e4736-00f067aa0ba902b7-01',tracestate='congo%3Dt61rcWkgMzE%2Crojo%3D00f067aa0ba902b7'*/
Then the database that supports Sqlcommenter can record its operation for this
query with a specified trace and publish its trace spans to a trace store, so
you can see your application trace spans correlated with query trace spans from
the database in one place.
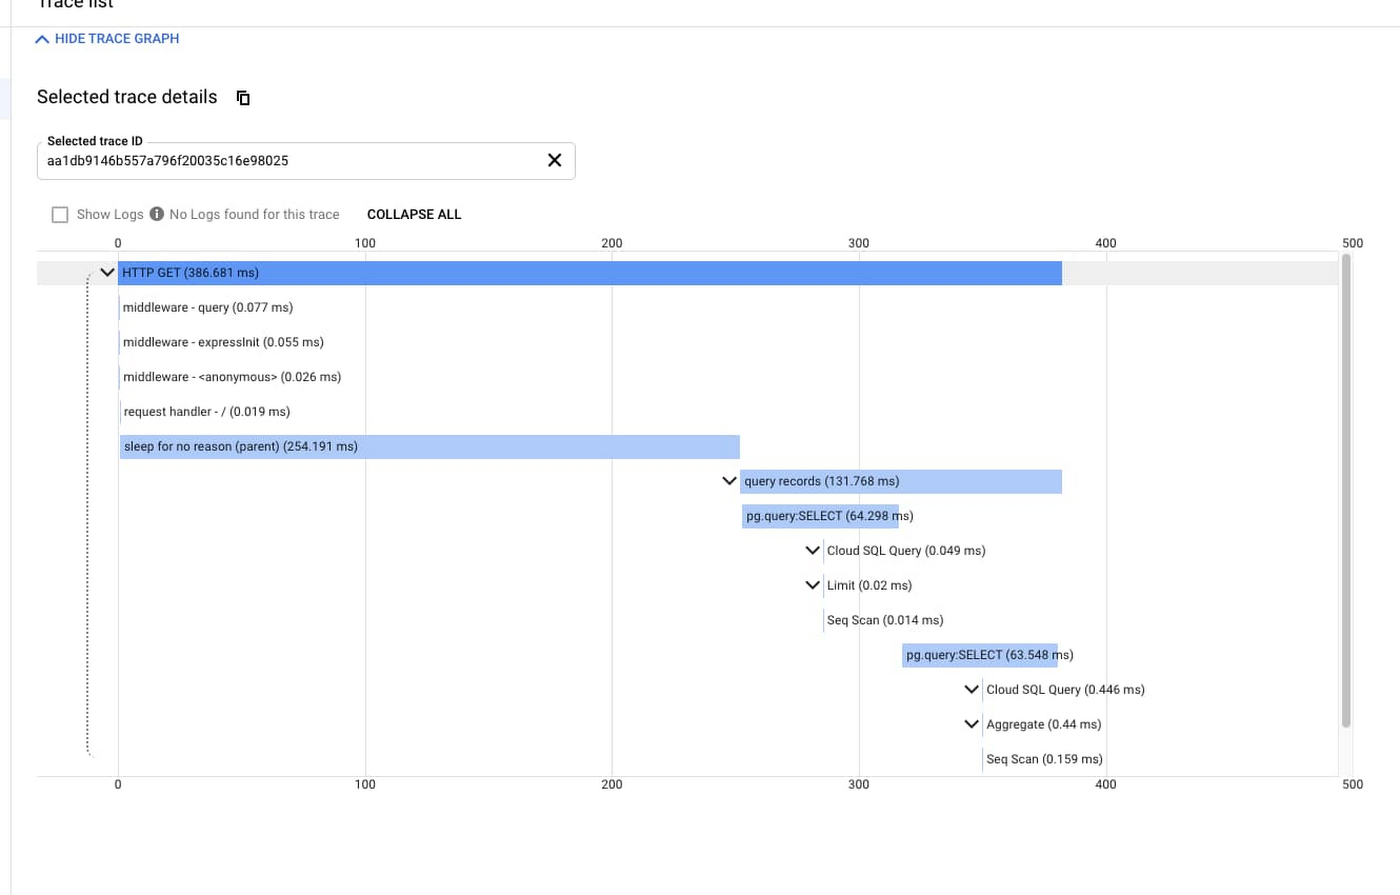
Picture coming from google cloud document.
Custom span name
If you don’t like the default span name, you can use
otelsql.WithSpanNameFormatter to customize the span name.
Here is the example usage:
otelsql.WithSpanNameFormatter(func(ctx context.Context, method otelsql.Method, query string) string {
    return string(method) + ": " + query
})
Then, the span name could become {method}: {query}. Here is an example of the
span name:
sql.conn.query: select current_timestamp
Filter spans
You can use otelsql.SpanFilter from otelsql.SpanOptions to filter out spans
you don’t want to generate. It is useful when you want to discard some spans.
What’s next?
You should now be able to apply what you have learned from this blog post to your own installation of otelsql.
I would love to hear about your experience! Star otelsql if you find it
helpful! If you run into any problems, don’t hesitate to
reach out or
create an issue.