Prometheus and OpenTelemetry - Better Together
Blog posts are not updated after publication. This post is more than a year old, so its content may be outdated, and some links may be invalid. Cross-verify any information before relying on it.

Tools such as Prometheus and OpenTelemetry help us monitor the health, performance, and availability of our complex distributed systems. Both are open source projects under the Cloud Native Computing Foundation (CNCF) umbrella – but what role does each play in observability?
OpenTelemetry (OTel for short), is a vendor-neutral open standard for instrumenting, generating, collecting, and exporting telemetry data. Prometheus is a fixture of the observability landscape, widely relied upon for monitoring and alerting within organizations.
While both Prometheus and OTel emit metrics, there is a lot to cover on the differences and similarities, and is out of scope for this article. Rather, we want to show you how OTel supports Prometheus, specifically in a Kubernetes environment. You’ll learn:
- How the OTel Collector’s Prometheus Receiver can be used to ingest Prometheus metrics.
- Alternative methods for Prometheus metric collection through OTel-native options such as the K8s cluster receiver and Kubelet stats receiver.
We’ll also do a technical dive into the OTel Operator’s Target Allocator (TA) and learn:
- How it can be used for Prometheus service discovery.
- How it ensures even distribution of Prometheus targets.
OTel and Prometheus
Since OTel is primarily focused on the instrumentation part of observability, it doesn’t provide a backend for storing telemetry; you have to forward the data to a backend vendor for storage, alerting, and querying.
Prometheus, on the other hand, provides a time-series data store you can use for your metrics, in addition to instrumentation clients. You can view graphs and charts, set up alerts, and query your data via their web user interface. It also encompasses a data format, known as Prometheus text-based exposition format.
Prometheus data is stored as a dimensional time-series, meaning that the data has attributes (for example, labels or dimensions) and a timestamp.
The Prometheus server collects Prometheus metrics data from targets defined in a configuration file. A target is an endpoint that exposes metrics for the Prometheus server to store.
Prometheus is so ubiquitous in the monitoring space that many tools natively emit metrics in Prometheus format, including Kubernetes and HashiCorp’s Nomad. And for those that don’t, there are a number of vendor- and community-built Prometheus exporters to aggregate and import data into Prometheus.
While you can use Prometheus to monitor a variety of infrastructure and application metrics, one of its most popular use cases is to monitor Kubernetes. This is the aspect of Prometheus monitoring that we will focus on in this article.
Prometheus metrics with OpenTelemetry
In this section, you’ll learn about a couple of OTel Collector components that demonstrate the interoperability between OTel and Prometheus.
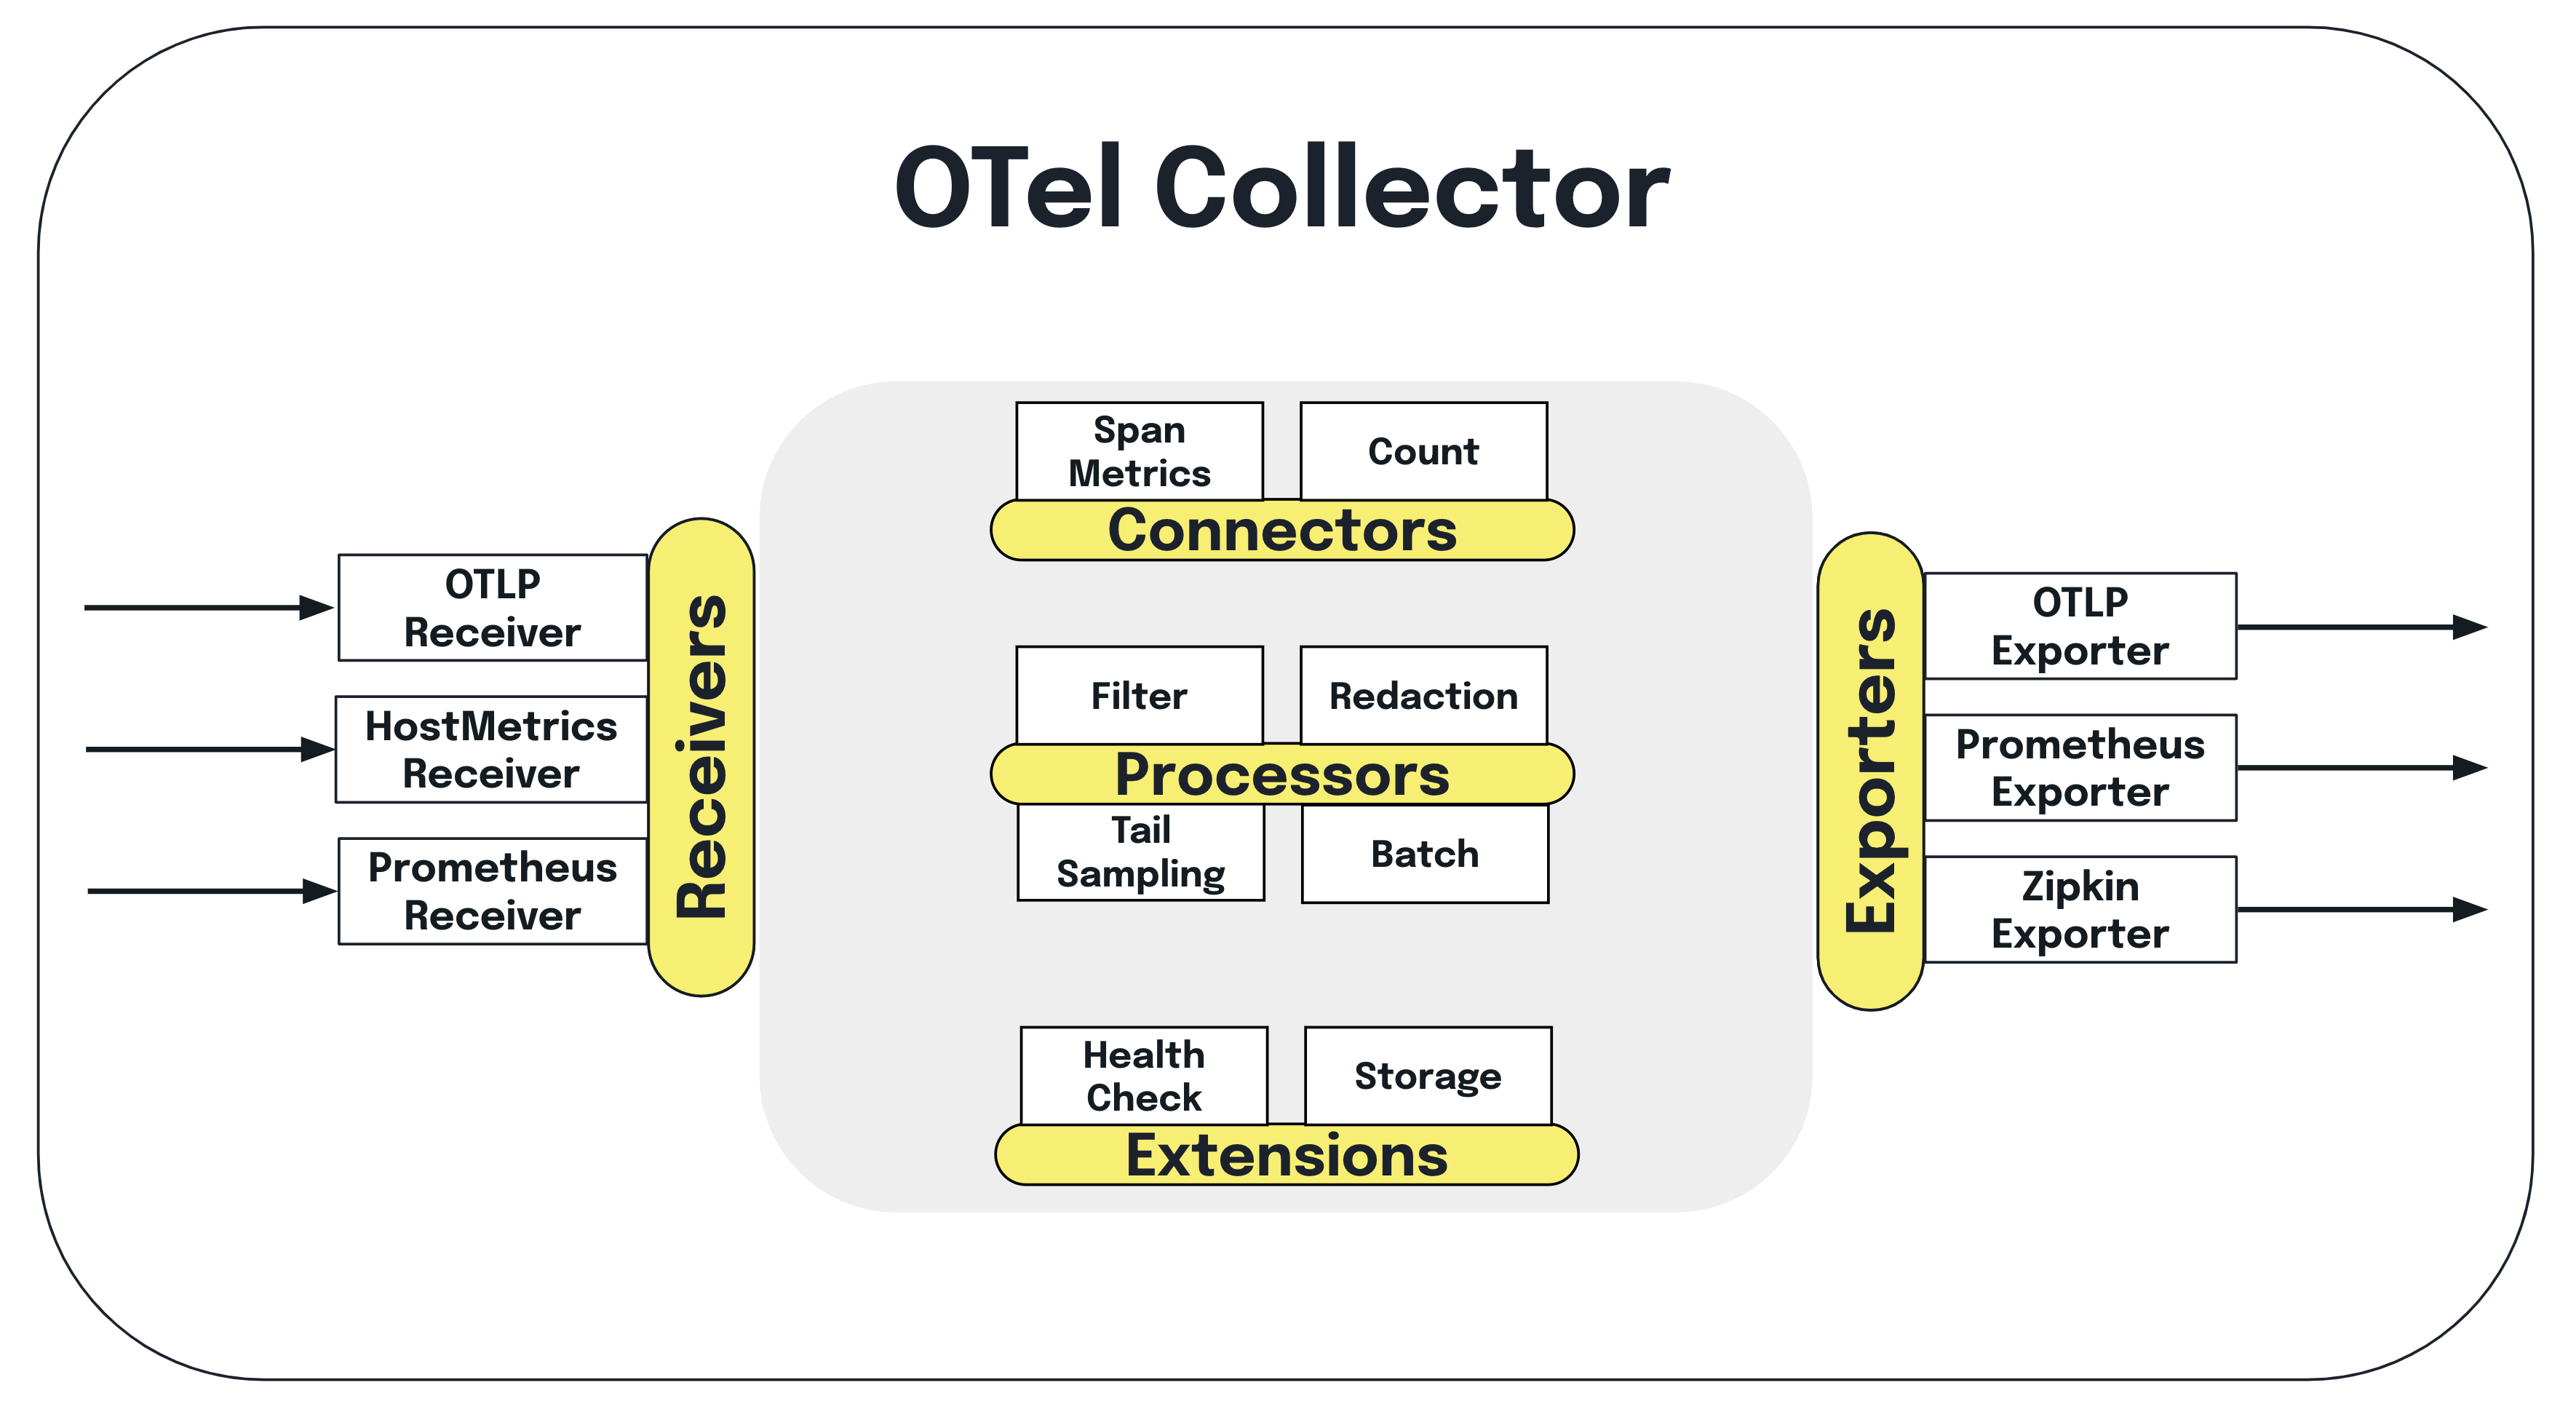
First, let’s do a quick refresher on the Collector – it’s an OTel component that can be used to collect telemetry from multiple sources and export data to multiple destinations. The Collector also handles telemetry processing, such as modifying data attributes and scrubbing personally identifiable information. For example, you can use Prometheus SDKs to generate metrics, ingest them with the Collector, do some processing (if desired) and then forward them to your chosen backend.
The
Prometheus receiver
allows you to collect metrics from any software that exposes Prometheus metrics.
It serves as a drop-in replacement for Prometheus to scrape your services, and
supports the
full set
of configurations in scrape_config.
If you are interested in exemplars, which is a recorded value that associates OTel context with a metric event, you can also use the Prometheus receiver. Note that exemplars are currently only available in OpenMetrics format.
Something to consider with this component is that it is under active development; as such, it has several limitations, including that it’s a stateful component. Additionally, it is not recommended to use this component when multiple replicas of the Collector are run without the target allocator, because in this state:
- The Collector is unable to auto-scale the scraping
- If the replicas are running with the same config, it will scrape the targets multiple times
- You will need to configure each replica with a different scraping config if you want to manually shard the scraping
For exporting metrics from the OTel Collector to Prometheus, you have the following options: the Prometheus exporter, and the Prometheus Remote Write exporter. You can also use the OTLP HTTP exporter, which comes with the Collector by default, and use Prometheus’ native OTLP endpoint. Note that Prometheus also now supports OTLP natively.
The Prometheus exporter allows you to ship data in the Prometheus format, which is then scraped by a Prometheus server. It’s used to report metrics via the Prometheus scrape HTTP endpoint. You can learn more by trying out this example. However, the scraping won’t really scale, as all the metrics are sent in a single scrape.
To get around the scaling concern, you can alternatively use the Prometheus Remote Write exporter, which allows you to push data to Prometheus from multiple Collector instances with no issues. Since Prometheus also accepts remote write ingestion, you can also use this exporter if you are generating OTel metrics and want to ship them to a backend that is compatible with Prometheus remote write.
Note that the Prometheus Remote Write in the Prometheus Server doesn’t currently support metadata, such as Help and Type. For more information, check out issue #13163 as well as issue #12608. This will be addressed in Prometheus Remote Write v2.0.
To learn more about the architecture of both exporters, see Use Prometheus Remote Write exporter.
Using the Target Allocator
Scalability is a common challenge with Prometheus; that’s the ability to effectively maintain performance and resource allocation while managing an increasing number of monitored targets and metrics. One option to help with this is sharding the workload based on labels or dimensions, which means using multiple Prometheus instances to handle your metrics according to specific parameters. This could help decrease the burden on individual instances. However, there are two things to consider with this approach.
The first is that to get around querying sharded instances, you need a management instance; this means that you need to have N+1 Prometheus instances, where the +1’s memory is equal to N, thereby doubling your memory requests. Secondly, Prometheus sharding requires that each instance scrape the target, even if it’s going to be dropped.
Something to note is that if you can have a Prometheus instance with the combined amount of memory of individual instances, there is not much benefit to sharding, since you can scrape everything directly using the larger instance. A reason that people shard is usually for some amount of fault tolerance. For example, if one Prometheus instance is out of memory (OOM), then your entire alerting pipeline won’t be offline.
Luckily, the OTel Operator’s Target Allocator (TA) is able to help with some of
this. For instance, it can automatically drop any targets it knows won’t be
scraped. The TA also automatically shards the targets for you, whereas if you
shard with hashmod you’ll need to
update your config based on the number of replicas you have.
The TA also allows you to continue using resources like PodMonitor and
ServiceMonitor to continue collecting Prometheus metrics about your Kubernetes
infrastructure.
The Target Allocator is part of the OTel Operator. The OTel Operator is a Kubernetes Operator that:
- Manages the OpenTelemetry Collector
- Injects and configures autoinstrumentation into your pods
In fact, the Operator creates two new custom resource (CR) types in Kubernetes to support this functionality: the OpenTelemetry Collector CR, and the Autoinstrumentation CR.
Today, we will be focusing on the Target Allocator. The TA is an optional component of the Operator’s OTel Collector management capabilities.
In a nutshell, the Target Allocator is a mechanism for decoupling the service discovery and metric collection functions of Prometheus in a way that allows them to be scaled independently. The OTel Collector manages Prometheus Metrics without needing to install Prometheus. The TA manages the configuration of the Collector’s Prometheus Receiver.
The Target Allocator serves two functions:
- Even distribution of Prometheus targets among a pool of OTel Collectors
- Discovery of Prometheus custom resources
Let’s dig into each of these.
Even distribution of Prometheus targets
The Target Allocator’s first job is to discover targets to scrape and OTel Collectors to allocate targets to. It does so as follows:
- The Target Allocator finds all of the metrics targets to scrape
- The Target Allocator finds all of the available Collectors
- The Target Allocator determines which Collectors scrape which metrics
- The Collectors query the Target Allocator to find out what metrics to scrape
- The Collectors scrape their assigned targets
This means that the OTel collectors – not a Prometheus scraper – collect the metrics.
A Target is an endpoint that supplies Metrics for Prometheus to store. A Scrape is the action of collecting Metrics through an HTTP request from a targeted instance, parsing the response, and ingesting the collected samples to storage.
sequenceDiagram
  participant Target Allocator
  participant Metrics Targets
  participant OTel Collectors
  Target Allocator ->>Metrics Targets: 1. Discover Metrics targets
  Target Allocator ->>OTel Collectors: 2. Discover available Collectors
  Target Allocator ->>Target Allocator: 3. Assign Metrics targets
  OTel Collectors ->>Target Allocator: 4. Query TA for Metrics endpoints scrape
  OTel Collectors ->>Metrics Targets: 5. Scrape Metrics target
Discovery of Prometheus custom resources
The Target Allocator’s second job is to provide the discovery of Prometheus Operator CRs, namely the ServiceMonitor and PodMonitor.
In the past, all Prometheus scrape configurations had to be done via the Prometheus Receiver. When the Target Allocator’s service discovery feature is enabled, the TA simplifies the configuration of the Prometheus receiver, by creating scrape configurations in the Prometheus receiver from the PodMonitor and ServiceMonitor instances deployed in your cluster.
flowchart RL
  pm(PodMonitor)
  sm(ServiceMonitor)
  ta(Target Allocator)
  oc1(OTel Collector)
  oc2(OTel Collector)
  oc3(OTel Collector)
  ta --> pm
  ta --> sm
  oc1 --> ta
  oc2 --> ta
  oc3 --> ta
  sm ~~~|1\. Discover Prometheus Operator CRs| sm
  ta ~~~|2\. Add job to TA scrape configuration| ta
  oc3 ~~~|3\. Add job to OTel Collector scrape configuration| oc3
Even though Prometheus is not required to be installed in your Kubernetes cluster to use the Target Allocator for Prometheus CR discovery, the TA does require that the ServiceMonitor and PodMonitor be installed. These CRs are bundled with Prometheus Operator; however, they can be installed standalone as well. The easiest way to do this is to grab a copy of the individual PodMonitor YAML and ServiceMonitor YAML custom resource definitions (CRDs).
OTel supports the PodMonitor and ServiceMonitor Prometheus resources because these are widely-used in Kubernetes infrastructure monitoring. As a result, the OTel Operator developers wanted to make it easy to add them to the OTel ecosystem.
PodMonitor and ServiceMonitor are limited to collecting metrics from pods, and are unable to scrape other endpoints, such as the kubelet. In that case, you still have to rely on Prometheus scrape configs in the Collector’s Prometheus Receiver.
Configuration
The following is the YAML config for the OTel Collector CR. Note that this
Collector is running in a namespace called opentelemetry, but it can run in
whatever namespace you like.
The main components are:
- mode: This is one of four OTel Collector deployment modes supported by the Operator: Sidecar, Deployment, StatefulSet and DaemonSet.
- targetallocator: This is where you configure the Target Allocator. Note that the Target Allocator only works for the Deployment, DaemonSet, and StatefulSet modes.
- config: This is where you configure the OTel Collector’s config YAML.
apiVersion: opentelemetry.io/v1alpha1
kind: OpenTelemetryCollector
metadata:
  name: otelcol
  namespace: opentelemetry
spec:
  mode: statefulset
  targetAllocator:
    enabled: true
    serviceAccount: opentelemetry-targetallocator-sa
    prometheusCR:
      enabled: true
  config: |
    receivers:
      otlp:
        protocols:
          grpc:
          http:
      prometheus:
        config:
          scrape_configs:
          - job_name: 'otel-collector'
            scrape_interval: 30s
            static_configs:
            - targets: [ '0.0.0.0:8888' ]
        target_allocator:
          endpoint: http://otelcol-targetallocator
          interval: 30s
          collector_id: "${POD_NAME}"
…
To use the Target Allocator, you need to set spec.targetallocator.enabled to
true. (See previous note about supported modes.)
Next, you need to make sure that the Prometheus receiver of the deployed
Collector is made aware of the Target Allocator in the Collector config section
of the spec by setting the target_allocator.endpoint:
receivers:
  prometheus:
    config:
      scrape_configs:
        - job_name: 'otel-collector'
          scrape_interval: 30s
          static_configs:
            - targets: ['0.0.0.0:8888']
    target_allocator:
      endpoint: http://otelcol-targetallocator
      interval: 30s
      collector_id: '${POD_NAME}'
The Target Allocator endpoint that the Prometheus receiver config is pointing to
is a concatenation of the OTel Collector’s name (otelcol, in our case) and the
-targetallocator suffix.
To use the Prometheus service discovery functionality, you’ll need to enable it
by setting spec.targetallocator.prometheusCR.enabled to true.
Finally, if you want to enable the Prometheus CR functionality of the Target
Allocator, you’ll need to define your own ServiceMonitor and PodMonitor
instances. The following is a sample ServiceMonitor definition that says, find
me a service with the label app: my-app, with an endpoint that’s a port named
prom, and scrape it every 15 seconds.
apiVersion: monitoring.coreos.com/v1
kind: ServiceMonitor
metadata:
  name: sm-example
  namespace: opentelemetry
  labels:
    app.kubernetes.io/name: py-prometheus-app
    release: prometheus
spec:
  selector:
    matchLabels:
      app: my-app
  namespaceSelector:
    matchNames:
      - opentelemetry
  endpoints:
    - port: prom
      interval: 15s
The corresponding Service definition, which is just a standard
Kubernetes Service
definition, is as follows:
apiVersion: v1
kind: Service
metadata:
  name: py-prometheus-app
  namespace: opentelemetry
  labels:
    app: my-app
    app.kubernetes.io/name: py-prometheus-app
spec:
  selector:
    app: my-app
    app.kubernetes.io/name: py-prometheus-app
  ports:
    - name: prom
      port: 8080
Because the Service has a label called app: my-app and a port named prom,
it will get picked up by the ServiceMonitor.
You can either create separate ServiceMonitors for each service you wish to monitor, or create a single ServiceMonitor to encompass all of your services. The same applies for the PodMonitor.
Before the Target Allocator can start scraping, you need to set up Kubernetes role-based access controls (RBAC). This means that you need to have a ServiceAccount and corresponding cluster roles so that the Target Allocator has access to all of the necessary resources to pull metrics from.
You can create your own ServiceAccount, and reference it as
spec.targetAllocator.serviceAccount in the OTel Collector CR. You’ll then need
to configure the
ClusterRole
and
ClusterRoleBinding
for this service account.
If you omit the ServiceAccount configuration, the Target Allocator creates a
ServiceAccount automatically for you. The ServiceAccount’s default name is a
concatenation of the Collector name and the -collector suffix. By default,
this ServiceAccount has no defined policy, so you’ll need to create your own
ClusterRole
and
ClusterRoleBinding.
The following is an example RBAC configuration taken from the OTel Target Allocator readme. It includes the ServiceAccount, ClusterRole, and ClusterRoleBinding configurations:
apiVersion: v1
kind: ServiceAccount
metadata:
  name: opentelemetry-targetallocator-sa
  namespace: opentelemetry
---
apiVersion: rbac.authorization.k8s.io/v1
kind: ClusterRole
metadata:
  name: opentelemetry-targetallocator-role
rules:
  - apiGroups:
      - monitoring.coreos.com
    resources:
      - servicemonitors
      - podmonitors
    verbs:
      - '*'
  - apiGroups: ['']
    resources:
      - namespaces
    verbs: ['get', 'list', 'watch']
  - apiGroups: ['']
    resources:
      - nodes
      - nodes/metrics
      - services
      - endpoints
      - pods
    verbs: ['get', 'list', 'watch']
  - apiGroups: ['']
    resources:
      - configmaps
    verbs: ['get']
  - apiGroups:
      - discovery.k8s.io
    resources:
      - endpointslices
    verbs: ['get', 'list', 'watch']
  - apiGroups:
      - networking.k8s.io
    resources:
      - ingresses
    verbs: ['get', 'list', 'watch']
  - nonResourceURLs: ['/metrics']
    verbs: ['get']
---
apiVersion: rbac.authorization.k8s.io/v1
kind: ClusterRoleBinding
metadata:
  name: opentelemetry-targetallocator-rb
subjects:
  - kind: ServiceAccount
    name: opentelemetry-targetallocator-sa
    namespace: opentelemetry
roleRef:
  kind: ClusterRole
  name: opentelemetry-targetallocator-role
  apiGroup: rbac.authorization.k8s.io
Zooming in a bit on the previous ClusterRole, the following rules will provide the minimum access required for the Target Allocator to query all the targets it needs based on any Prometheus configurations:
- apiGroups: ['']
  resources:
    - nodes
    - nodes/metrics
    - services
    - endpoints
    - pods
  verbs: ['get', 'list', 'watch']
- apiGroups: ['']
  resources:
    - configmaps
  verbs: ['get']
- apiGroups:
    - discovery.k8s.io
  resources:
    - endpointslices
  verbs: ['get', 'list', 'watch']
- apiGroups:
    - networking.k8s.io
  resources:
    - ingresses
  verbs: ['get', 'list', 'watch']
- nonResourceURLs: ['/metrics']
  verbs: ['get']
If you enable the prometheusCR (set
spec.targetAllocator.prometheusCR.enabled to true) in the
OpenTelemetryCollector CR, you will also need to define the following roles.
These give the Target Allocator access to the PodMonitor and ServiceMonitor CRs.
It also gives namespace access to the PodMonitor and ServiceMonitor.
- apiGroups:
    - monitoring.coreos.com
  resources:
    - servicemonitors
    - podmonitors
  verbs:
    - '*'
- apiGroups: ['']
  resources:
    - namespaces
  verbs: ['get', 'list', 'watch']
Additional OTel components for Kubernetes
This section covers additional OTel Collector components you can use to capture Kubernetes metrics.
Receiving data:
- Kubernetes Cluster Receiver: collects cluster-level metrics and entity events from the Kubernetes API server
- Kubernetes Objects Receiver: collects (pull/watch) objects from the Kubernetes API server
- Kubelet Stats Receiver: pulls metrics from the Kubelet and sends it down the metric pipeline for further processing
- Host Metrics Receiver: scrapes system metrics from hosts that make up the cluster
Processing data:
- Kubernetes Attributes Processor: adds Kubernetes context, thereby
- enabling you to correlate application telemetry with your Kubernetes telemetry
- – considered one of the most important components for monitoring Kubernetes
- with OpenTelemetry
You can also use the Kubernetes attributes processor to set custom resource attributes for traces, metrics, and logs using the Kubernetes labels and annotations you’ve added to your pods and namespaces.
There are a few more Collector components you can implement to monitor Kubernetes, including Kubernetes-specific ones as well as general-use processors, such as the batch, memory limiter, and resource processors. To learn more, see Important Components for Kubernetes.
After you’ve configured the components in your Collector config file, you need to enable them within the pipelines section. A data pipeline enables you to collect, process, and route data from any source to one destination or more.
Pros and cons
The following are pros and cons of the setup we covered in this article.
Pros:
- Not having to maintain Prometheus as your data store, which means less infrastructure overall to maintain – especially if you go with an all-in-one observability backend to ingest OTel data (traces, metrics, logs).
- While you would still have to maintain the ServiceMonitor and PodMonitor, it’s a lot less work than keeping the Prometheus Operator up-to-date.
- Allows you to end up with a full OTel solution while still obtaining your Prometheus metrics
- OTel can provide traces and logs in addition to metrics, as well as correlation of these signals, thus enhancing the observability of Kubernetes environments.
- OTel provides handy tools, such as the Target Allocator and OTel Collector components, to provide flexibility for configuration and deployment options.
Cons:
- Adopting and managing a new observability tool involves a steep learning curve for users unfamiliar with OTel concepts, components, and workflows.
- Users of PromQL, Prometheus’ powerful query language, can still use it if they send metrics to a Prometheus-compatible backend.
- OTel itself contains many moving parts, and presents its own challenges with scalability and adoption.
- Maturity and stability within OTel varies; Prometheus has a mature ecosystem.
- Additional computational and human resources needed to maintain OTel components.
- Managing and maintaining both Prometheus and OTel components introduces operational complexity in your monitoring infrastructure.
Conclusion
Prometheus maintainers have also been further developing the interoperability between the two projects from the Prometheus side to make it easier for it to be the backend for OTLP metrics. For instance, Prometheus can now accept OTLP, and soon, you’ll be able to use Prometheus exporters to export OTLP. So if you have a service instrumented with a Prometheus SDK, you’ll be able to push OTLP and take advantage of the rich Prometheus exporter ecosystem for OTel users. The maintainers are also working on adding support for delta temporality. This component will aggregate delta samples to their respective cumulative counterparts. For more about Prometheus’ commitment to OTel, see Our commitment to OpenTelemetry.
However you decide to use OTel to gather Prometheus metrics, ultimately what is right for your organization depends on your business needs. Using the OTel components discussed previously, you could convert all your metrics into the Prometheus format, or you could convert your Prometheus metrics into OTLP. Although Prometheus itself was not built for long-term data storage and presents scaling challenges, there are open source projects such as Mimir, Thanos, and Cortex that can help with these concerns.
Whether or not you choose to implement these solutions in your organization, it’s nice to know that there are additional options out there to lead you to observability greatness with OTel and Prometheus.
A version of this article was originally posted to the New Relic blog.