How Should Prometheus Handle OpenTelemetry Resource Attributes? - A UX Research Report
On May 29th, 2025, I wrapped up my mentorship with Prometheus through the Linux Foundation Mentorship Program. My project focused on understanding how Prometheus handles OpenTelemetry resource attributes and how that experience could be improved for users. My job was to conduct user research to get the user perspective on this challenge. In three months, I conducted user and stakeholder interviews, ran a survey, and analyzed the findings.
In this article, I’ll share how I conducted the research, what I uncovered and where the communities involved could go from here.
Project background
OpenTelemetry (OTel) has something called a resource attribute, which is extra information about the source of a metric, like the service, host, or environment that generated it. Prometheus, a time-series database, uses labels to identify and query metrics. If resource attributes are converted to labels, they can cause what’s known as “a cardinality explosion”, essentially creating too many unique combinations that overwhelm the system. This usually happens if the attributes change often or include a lot of unique values, like user IDs or pod names.
Currently, there are three main approaches to handling this challenge:
- Map all resource attributes to labels: This creates cardinality explosion problems, especially for applications with large numbers of attributes or frequently changing attribute values.
- Selective promotion: Users manually choose which resource attributes are important enough to be converted to labels in Prometheus.
- Target info pattern: Put all resource attributes in a separate metric
called
target_info. When users need to query metrics involving specific resource attributes, they have to perform a “join” between the target info and their actual metrics.
These aren’t bad solutions technically, but they don’t make for the best user experience. So, I conducted this research to understand what the Prometheus maintainers might be missing about the user experience.
The research objectives were:
- Understand how engineers currently use OpenTelemetry resource attributes with Prometheus
- Identify pain points in the current integration
- Discover user expectations for how resource attributes should be represented
Research approach
My research approach was a mix of qualitative and quantitative research. I started with stakeholder interviews to understand the historical context and assess how open stakeholders were to changes that might result from my research. The stakeholders I spoke to represented a range of roles, from project founders and co-founders, to long-time maintainers with historical context, and others more directly involved in the ongoing challenges around resource attribute handling.
Next, I conducted user interviews to hear directly from people actually using these tools. Finally, I followed up with a survey to reach a broader audience and validate what I heard in interviews.
Stakeholder interviews insights
I spoke to 6 stakeholders—3 from each project:
Prometheus stakeholders:
- Julius Volz – Prometheus Co-founder
- Beorn Rabestein – Prometheus long-time maintainer
- Richard Hartmann – OpenMetrics co-founder and Prometheus maintainer
OpenTelemetry stakeholders:
- Juraci Paixão Kröhling – OpenTelemetry Governance Committee member
- Josh Suereth – OpenTelemetry Technical Committee member
- Austin Parker – OpenTelemetry co-founder and Governance Committee member
My conversations with stakeholders brought several interesting discoveries to light:
The Prometheus and OpenTelemetry communities hadn’t always communicated well and that prevented them from collaborating early on.
Much of the interoperability issues that exist now stem from the different philosophical and technical foundations on which each of the projects is built.
“If we think about exploratory situations or use cases, then we can justify a lot of the design decisions behind OpenTelemetry. And if we think about metrics and scaling, monitoring, for huge infra, then the design decisions for Prometheus are justified as well. So both have very good arguments.” — Juraci Paixão Kröhling
“I think one of the biggest [interoperability issues] is the difference between push and pull.” — Julius Volz
Julius later elaborated that his concern goes beyond the delivery mechanism itself. In his words:
“One of the biggest downsides of using OTLP to push metrics to Prometheus is that you end up throwing away one of the core features of Prometheus as a monitoring system: its pull-based metrics collection model that is based on dynamic service discovery information (so Prometheus always knows which targets should currently exist), and the resulting automatic target health monitoring via the synthetic ‘up’ metric that is generated for each target scrape.”
There’s a shared recognition of the importance of putting user needs first, even while maintaining some non-negotiables (for example, Prometheus keeping its pull model and not alienating existing users).
One key takeaway from the interviews for me was realizing that the current interoperability problems are not failures, but natural consequences of different communities solving different problems at different times. And it’s good to see both projects are working together now to make user experience better.
User interviews insights
The user interviews were just as revealing as the stakeholder conversations. I aimed to speak with about 10 users (admittedly ambitious) but managed to interview 7, and they all shared incredibly helpful perspectives.
The most prominent pain point users shared was the complexity of performing joins with the current integration. Another issue mentioned was the mismatch in metric names caused by character set limitations, but I understand that has since been addressed, as recent Prometheus releases now support UTF-8 characters (though this introduces the need for the more cumbersome quoted selector syntax in PromQL).
Regarding mental models, many users (both interviewees and survey respondents) don’t distinguish between resource attributes and Prometheus labels. They tend to think of them as the same thing.
“I would expect resource attributes as a rule to be treated exactly the same way as the attributes attached to the tracer, the metric… I wouldn’t draw a boundary between them.” — Interview Participant 1
I also learned about the various workarounds people use to handle resource attribute issues in their specific use cases. Some promote selected resource attributes to labels, others handle the conversion at the OpenTelemetry-Collector level to avoid dealing with it in Prometheus, and a few convert all attributes, though usually only when the number of attributes is small.
Survey insights
The survey helped me quantify what I was hearing in interviews and reach a broader audience. At the time of writing, we’ve had 134 responses, with 61 from our target group—people who use OTel and Prometheus together.
Here are the key findings:
- Users don’t conceptualize resource attributes as different from regular labels, yet current implementation treats them as separate metadata.
- Complex join syntax is a big barrier to adoption, with average developers unable to write basic queries accessing resource attributes.
- Manual attribute promotion creates operational overhead that scales poorly with team size and complexity.
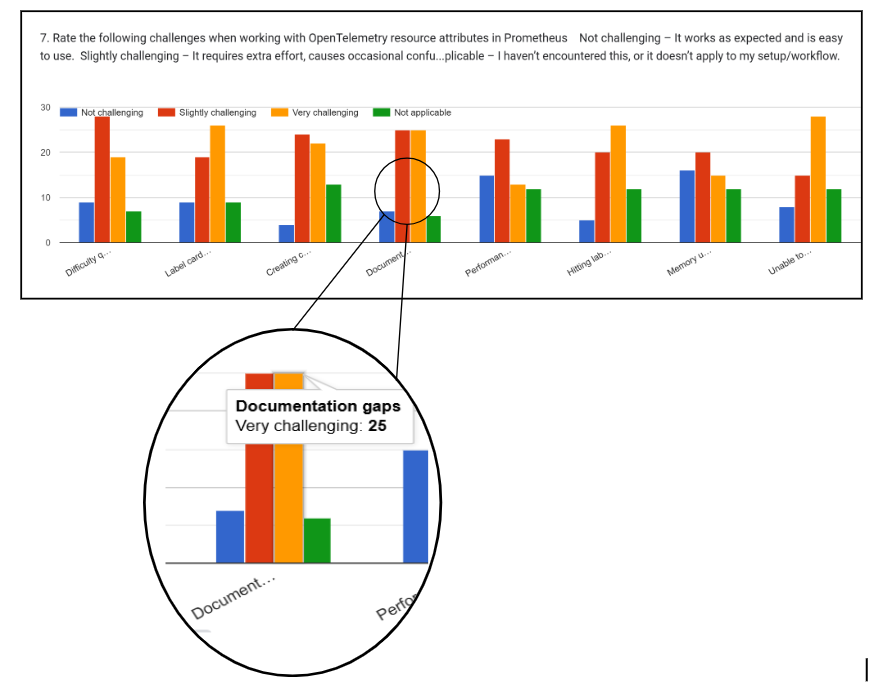
- 78% of respondents find documentation gaps a challenge in their use of resource attributes.
The survey patterns were consistent with what emerged from my qualitative research. For detailed results, see the anonymized survey responses
What I didn’t expect to learn (but did)
I began this research to understand user pain points with resource attribute handling, but I uncovered some unexpected and important findings.
One of the most surprising was the realization that OpenTelemetry’s Resource Detection feature allows users to selectively retain or drop resource attributes based on relevance using a conceptual pattern sometimes referred to as “telescoping.” Despite its potential, many users and even some members of the Prometheus community seem unaware of it. This lack of awareness may have contributed to the adoption of the “join” pattern, which has since proven to be problematic.
This highlights a broader issue: documentation and education gaps are a major barrier. In our survey, 78% of respondents cited documentation gaps as a challenge.
Another key realization is that earlier integration decisions, like the reliance on joins, were made without a full understanding of each tool’s capabilities, an unavoidable consequence of the lack of early collaboration and communication between the Prometheus and OpenTelemetry communities.
Recommended solutions
Based on conversations with stakeholders and end users, here are some of the proposed solutions, grouped by what’s feasible in the short term vs. what’s part of a longer-term vision:
Short-term solutions
- Improved documentation for attribute handling Since users find it easier to promote attributes than to join on target info, it may be worth de-emphasizing (or even sunsetting) documentation around joins, while making attribute promotion docs more prominent for those not yet aware of the option. The telescoping pattern of resource detection in OpenTelemetry also deserves more visibility and proper documentation. Additionally, users have suggested creating consolidated Prometheus–OpenTelemetry documentation that clearly explains how both systems handle resource attributes.
Long-term vision
Entity framework OpenTelemetry’s developing concept of entities could help Prometheus distinguish between identifying vs. descriptive attributes. This would guide which attributes become labels, and which are stored or filtered out.
Metadata storage Stakeholders also discussed the idea of adding first-class metadata support to Prometheus itself. This would allow certain resource attributes to be stored as metadata (not labels), avoiding cardinality costs while keeping the information available for queries or joins.
Expanding for exploratory telemetry This might be a stretch, but Prometheus could consider expanding its scope to better support exploratory telemetry use cases. Stakeholders showed openness to change, as long as Prometheus’s core architecture remains intact and existing users aren’t alienated. That suggests there may be room for evolution, especially if new capabilities can complement, rather than replace, current behavior.
I see OTel and Prometheus as coming from very different assumptions of how telemetry should work in general. So, while Prometheus is very opinionated on time series storage…OTel, on the other hand, comes from a tracing background, meaning it’s more explorative than Prometheus. So [with] Prometheus, I kinda know upfront what I need. [With] OpenTelemetry, I don’t know what I might need, so I store everything. — Juraci Paixão Kröhling
Cross-signal correlation Users mention using platforms that can ingest all telemetry types and correlate metrics, traces, and logs within a single system. While Prometheus will likely remain focused on just metrics, it could enable tooling that correlates metrics with telemetry stored in other databases. Prometheus currently supports exemplars, which allow linking metrics to traces, but that’s about the extent of their scope. They rely on tracing being present, which makes them less useful in environments where traces aren’t available or instrumented.
“One of the key innovative things in OpenCensus was… you could divide CPU usage by which requests were using CPU and get a metric that would say, ‘here’s CPU usage by request.’ That’s a thing you could accomplish in OpenCensus because it was all contextual-based metrics.” — Josh Suereth
There’s still work to be done. The communities will need time to develop and test solutions. But I’m proud that this research has provided a user-centered foundation for that work.
If you’re interested in the ongoing discussions, proposals, and feedback around these ideas, you can check out the GitHub repository where everything is being documented: OpenTelemetry Resource Attributes in Prometheus UX Research
Acknowledgments
This post would be incomplete without acknowledging my incredible mentors: Amy Super, Andrej Kiripolsky, and Arthur Silva Sens – thank you for trusting me with this challenging project and caring so deeply about my professional journey. You’re the real superstars.
To all the stakeholders and users who gave their time: thank you for engaging with this work and trusting me with your honest feedback. Your insights made this research meaningful.
What’s next for me
I’m excited to keep working at the intersection of UX and cloud native systems. If you know of opportunities similar to this mentorship, I’d love to hear from you! I’m a hard worker—just ask my mentors.