Inside Adobe's OpenTelemetry pipeline: simplicity at scale
As part of an ongoing series, the Developer Experience SIG interviews organizations about their real-world OpenTelemetry Collector deployments to share practical lessons with the broader community. This post features Adobe, a global software company whose observability team has built an OpenTelemetry-based telemetry pipeline designed for simplicity at massive scale, with thousands of collectors running per signal type across the company’s infrastructure.
Organizational structure
Adobe’s central observability team is responsible for providing observability infrastructure across the company. However, as Bogdan Stancu, Senior Software Engineer, explained, Adobe’s history of acquisitions means the landscape is not fully consolidated. Some large product groups have their own dedicated observability teams, while the central team serves as the primary provider.
The OpenTelemetry-based pipeline was introduced as a new option alongside existing monitoring solutions, designed primarily for new applications and deployments. Adoption is voluntary, not mandated. Existing applications with established monitoring have not been migrated.
OpenTelemetry adoption
The decision to adopt OpenTelemetry was driven by alignment between the project’s capabilities and the team’s goals. The observability team needed a solution that could serve Adobe’s diverse technology landscape, support multiple backends, and remain simple for service teams to adopt.
“It matched everything that we wanted,” Bogdan said.
The OpenTelemetry Operator, the Collector’s component model, and community Helm charts provided the building blocks for a platform-level observability offering that could scale without requiring deep OpenTelemetry expertise from individual service teams.
Architecture: a three-tier collector pipeline
Adobe’s collector architecture follows a three-tier design: a user-facing Helm chart containing two collectors, a centralized managed namespace with per-signal collector deployments, and the observability backends.
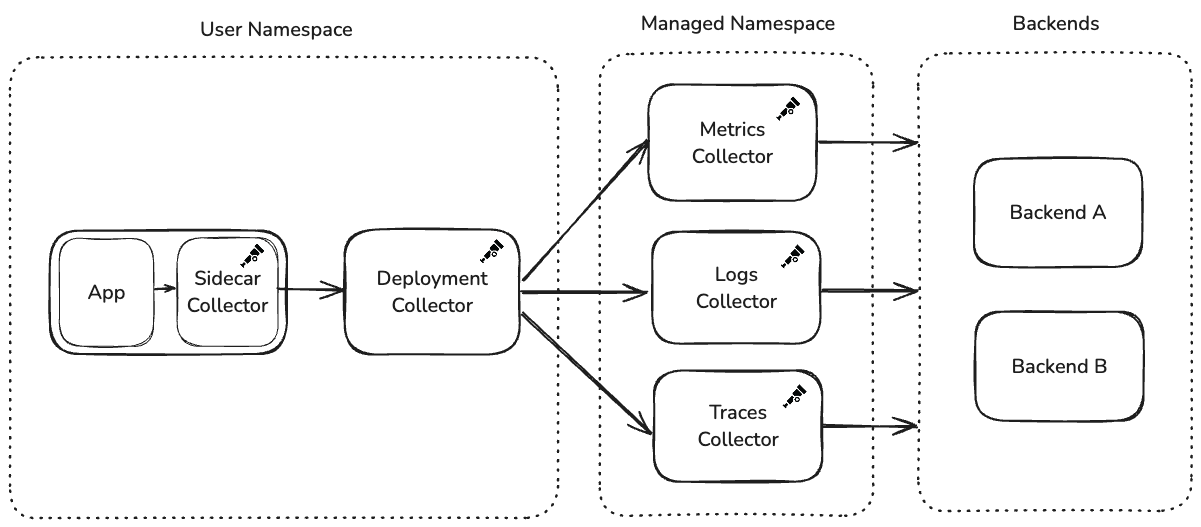
Tier 1: the user Helm chart
The observability team provides a Helm chart that service teams deploy into their own namespaces. This chart creates two collectors:
Sidecar Collector (in the application pod): Runs alongside the application container and is intentionally locked down. Service teams cannot modify its configuration. It collects all telemetry: metrics, logs, traces, regardless of what the team has chosen to export downstream. The configuration is immutable to prevent application restarts caused by configuration changes.
Deployment Collector (standalone): Receives telemetry from the sidecar over OTLP and handles routing and export. Unlike the sidecar, this collector is configurable through Helm values. The observability team provides sensible defaults, but service teams can customize exporters and add new destinations. When configuration changes, only the deployment collector restarts. The application pod and its sidecar remain untouched.
Tier 2: the managed namespace
The deployment collectors forward telemetry to a centralized namespace managed entirely by the observability team. A key architectural decision here is signal-level isolation: the managed namespace runs a separate collector deployment for each telemetry type: one for metrics, one for logs, and one for traces.
If a backend becomes rate-limited or starts rejecting data for one signal type, the others continue flowing uninterrupted. Despite handling thousands of collectors’ worth of upstream traffic, these managed deployments have generally operated at default replica counts without requiring aggressive auto-scaling.
Service teams configure their desired backend through Helm values, which sets an HTTP header on OTLP exports. The managed namespace collectors use this header with the routing connector to direct telemetry to the correct exporter.
Tier 3: the observability backends
The managed namespace collectors export telemetry to backend destinations managed by the observability team. Multiple backends are supported, and teams select their destination through the Helm chart’s values file.
Auto-instrumentation: two lines and it works
Adobe leverages the OpenTelemetry Operator for auto-instrumentation across the languages supported by OpenTelemetry. The Operator is deployed to every cluster, and service teams enable instrumentation by adding two annotations to their Kubernetes deployment manifests:
instrumentation.opentelemetry.io/inject-java: 'true'
sidecar.opentelemetry.io/inject: 'true'
“People add two lines in their deployment. And it just works,” Bogdan said.
Teams select their language in the Helm values, and the Operator handles the rest. While teams are free to add manual SDK instrumentation—the sidecar accepts all OTLP data—the observability team’s supported path focuses on the auto-instrumentation experience. The Operator has handled the scale of managing sidecars and auto-instrumentation across the deployment fleet without issues.
This design philosophy runs through the entire platform: make the default path require as little effort as possible, while leaving the door open for advanced use cases.
Custom distribution and components
Adobe builds its own OpenTelemetry Collector distribution to include only the components they use, avoiding unnecessary dependencies from Contrib. This custom distribution is the default in the Helm chart provided to service teams. However, teams can manually switch to the Contrib distribution if they need components not included in the custom build.
Adobe also maintains custom components, most notably an extension addressing a fundamental challenge in their chained collector architecture.
The chain collector problem
When collectors are chained, error visibility becomes a problem. The OTLP transaction between the user’s deployment collector and the managed namespace collector completes with a 200 response before the managed namespace collector attempts to export to the backend. If the backend rejects the data, the error is only visible in the managed namespace collector’s logs.
“The user would just see 200s. Metrics exported, all good,” Bogdan explained. “Which we didn’t want.”
To address this, Bogdan built a custom extension that acts as a circuit breaker for backend authentication. The extension runs in the managed namespace collector’s receiver, proactively sending mock authentication requests to the backend and caching results. If authentication fails, it returns a 401 to the upstream collector before the OTLP transaction completes, propagating the error back to where users can see it.
Building this extension was one of Bogdan’s first Go projects. The experience of trying to contribute upstream sparked deeper involvement with the OpenTelemetry community. Looking ahead, Bogdan would welcome a more general back-pressure mechanism in the Collector, where exporter failures propagate upstream through chained collectors.
Deployment and lifecycle management
The observability team upgrades their collector distribution and the OpenTelemetry Operator on a quarterly cadence. Upgrade issues have been rare.
When the Helm chart is updated, service teams pick up the new collector version
on their next deployment. However, the observability team has encountered a
compatibility challenge between the Operator and older collector versions: when
the Operator is upgraded, it can modify the OpenTelemetryCollector custom
resource to align with new configuration expectations. If a service team is
running a significantly older collector version, these changes can be
incompatible, preventing collectors from starting.
The resolution is straightforward—upgrading the collector fixes the issue—but it has caused confusion for teams whose collectors suddenly break without any changes on their end.
Navigating component deprecations
Adobe’s deployment has also navigated component deprecations as OpenTelemetry evolves. The team originally used the routing processor to direct telemetry to different backends based on HTTP headers, but migrated to the routing connector when the processor was deprecated.
While the migration required work, the team views this as an expected part of working with a rapidly evolving project.
“This is a risk we knew about, the whole OpenTelemetry landscape is changing constantly and the benefits outweigh the ‘issues’ if you can call fast development an issue,” Bogdan explained.
What works well
The overall experience has been positive. The Collector’s component model, the auto-instrumentation experience via the Operator, and the Helm chart-based deployment model have all worked reliably. The plug-and-play nature of the platform, where teams go from zero to full observability with minimal configuration, has been positively received by adopting teams.
Advice for others
Based on Adobe’s experience building a platform-level observability pipeline:
- Treat OpenTelemetry as a platform to build on: Don’t expect it to solve all your problems out of the box. It’s designed to be extended and customized for your specific needs.
- Don’t be afraid to build custom components: The Collector’s architecture makes it straightforward to build extensions tailored to your needs.
- Design for user simplicity: Make the default path require minimal effort. The teams consuming your platform are not observability experts.
- Plan for error visibility in chained collectors: OTLP transaction success does not guarantee end-to-end delivery. Consider how errors will surface to users.
What’s next
Adobe’s story illustrates how a central observability team can offer a scalable, self-service OpenTelemetry pipeline across a large and diverse organization. By combining the Operator, Helm charts, sidecars, and per-signal collector deployments, they’ve created a platform where service teams get observability with minimal effort, while the observability team retains control over centralized infrastructure.
We’ll continue sharing stories like this one, highlighting how different organizations tackle the challenges of running OpenTelemetry in production.
Have your own OpenTelemetry story to share? Join us in the CNCF #otel-devex Slack channel. We’d love to hear how you’re using OpenTelemetry and how we can keep improving the developer experience together.