How Mastodon Runs OpenTelemetry Collectors in Production
At the beginning of 2025, the OpenTelemetry Developer Experience SIG published the results of its first community survey. One of the strongest themes was clear: teams want more real-world examples of how the OpenTelemetry SDKs and the OpenTelemetry Collector are actually used in production.
To help close that gap, the SIG began collecting stories directly from end users—across industries, architectures, and company sizes. This post kicks off a new series focused specifically on organizations’ real world stories, starting with a small but uniquely challenging case.
This first story features Mastodon, a non-profit organization operating at global scale with a remarkably small team.
Mastodon at a glance
Mastodon is a free, open source, decentralized social media platform operated by a non-profit organization.
Decentralization is not a marketing term here; it is a core architectural principle. Anyone can run their own Mastodon server, and those independently operated servers interoperate using open protocols as part of what is called the Fediverse—a federated network of independent social platforms that communicate with one another using standardized protocols such as ActivityPub. Much like email, users can communicate across instances regardless of who operates them.
This philosophy shapes not just Mastodon’s feature decisions, but also its approach to observability.
Organizational structure
The entire Mastodon organization consists of around 20 people, and observability infrastructure (including the OpenTelemetry Collector) is managed by a single engineer.
Despite the small team size, Mastodon operates two large, production Mastodon instances:
Runs on Kubernetes with autoscaling between 9 and 15 nodes (16 cores, 64 GB RAM each). Web frontend scale between 5 and 20 pods, while various Sidekiq worker pools scale between 10 and 40 pods. On average, mastodon.social has 70–80 pods running at any given time. This platform handles up to 300,000 active users per day and approximately 10 million requests per minute.
Runs on Kubernetes with autoscaling between 3 and 6 nodes (8 cores, 32 GB RAM each). Web frontend scale between 3 and 10 pods, and Sidekiq pools scale between 5 and 15 pods, resulting in an average of 20–30 pods in total. This instance operates at a smaller but still substantial scale.
With such limited operational bandwidth, simplicity and reliability are non-negotiable.
OpenTelemetry adoption: Freedom of choice by design
Because Mastodon is open source and designed to be run by others, the team wanted a telemetry solution that preserved operator freedom.
OpenTelemetry became the default because it allows each Mastodon server operator to decide how—or whether—telemetry is collected.
Using simple environment variable configuration, operators can choose to:
- Send telemetry directly to an observability backend (using only the Ruby SDK configuration)
- Route telemetry through an OpenTelemetry Collector
- Disable telemetry entirely
The core Mastodon organization does not track how external instances handle observability. What matters is that the emitted telemetry adheres strictly to OpenTelemetry semantic conventions, making it usable everywhere.
This approach avoids vendor-specific data models and ensures compatibility with the broader OpenTelemetry ecosystem—without Mastodon having to maintain its own conventions.
Collector architecture: One per namespace, no more
Mastodon’s Collector architecture is intentionally minimal.
A single OpenTelemetry Collector per Kubernetes namespace handles all telemetry signals: traces, metrics, and logs. There are no separate gateway and agent tiers, no complex routing layers, and no custom deployment tooling.
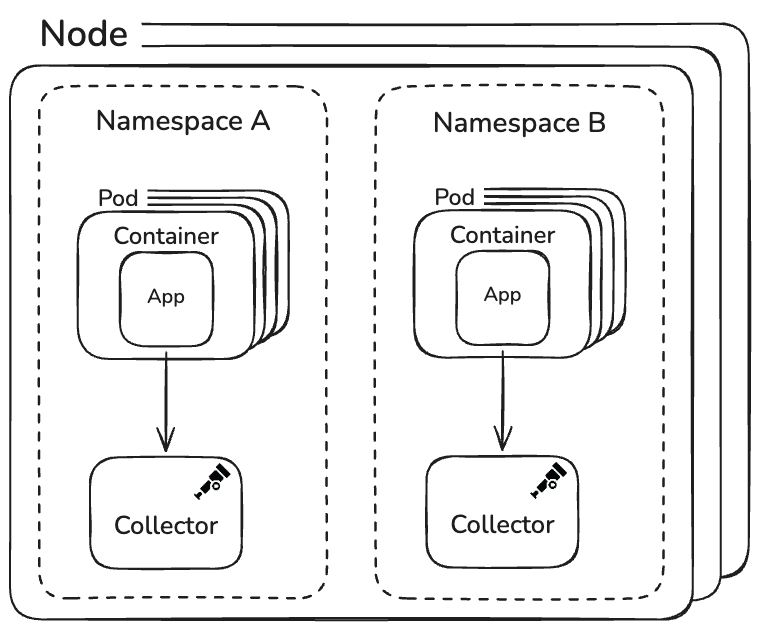
Given the scale and traffic, this has proven more than sufficient.
During the interview, Tim Campbell, Software Engineer at Mastodon, shared that in the ~2 years they’ve been running the Collector, they’ve never had a single issue with it.
“To my surprise, to my very pleasant surprise, I haven’t run into a single issue. Because we’re using a Kubernetes operator for it, if it ever does have any issue, it just restarts automatically. At least as far as the actual traces and logs go in Datadog, I haven’t seen any gaps. Memory and process-wise, it’s stayed perfectly happy within the limits that we’ve set.”
Deployment and lifecycle management
To keep operational overhead as low as possible, Mastodon relies on:
- The OpenTelemetry Operator for Kubernetes
- Argo CD for Git-based deployments and promotion
Each Collector is defined as an OpenTelemetryCollector custom resource. From
there, Kubernetes handles reconciliation, restarts, and lifecycle management
automatically.
“Basically we just need to create a yaml file for each
OpenTelemetryCollectorobject we need to create, and Argo will automatically deploy/update what we need.”
This model provides:
- Declarative configuration
- Automatic recovery on failure
- Clear auditability through Git history
Notably, Mastodon does not enforce strict CPU or memory limits on Collector pods. In practice, resource consumption has remained negligible compared to the rest of the platform.
Traffic management through sampling
Rather than relying on resource limits, Mastodon controls observability overhead primarily through tail-based sampling.
- On mastodon.social, successful traces are sampled at roughly 0.1%, resulting in only a few dozen traces per minute despite extremely high traffic.
- On mastodon.online, sampling is slightly more permissive but follows the same principles.
- All error traces are always collected, ensuring full visibility into failures.
This approach keeps data volume predictable while preserving high-value diagnostic data.
Configuration: Opinionated, but minimal
Mastodon uses the OpenTelemetry Collector Contrib distribution, primarily for convenience—it includes everything they need without requiring custom builds.
The configuration focuses on:
- OTLP ingestion for all signals
- Kubernetes metadata enrichment
- Resource detection
- Tail-based sampling
- Transformation for backend compatibility
A full production configuration is included below for reference (you can also view it on otelbin):
apiVersion: opentelemetry.io/v1beta1
kind: OpenTelemetryCollector
metadata:
  name: mastodon-social
  namespace: mastodon-social
spec:
  nodeSelector:
    joinmastodon.org/property: mastodon.social
  env:
    - name: DD_API_KEY
      valueFrom:
        secretKeyRef:
          name: datadog-secret
          key: api-key
    - name: DD_SITE
      valueFrom:
        secretKeyRef:
          name: datadog-secret
          key: site
  config:
    receivers:
      otlp:
        protocols:
          grpc:
            endpoint: 0.0.0.0:4317
          http:
            endpoint: 0.0.0.0:4318
            cors:
              allowed_origins:
                - 'http://*'
                - 'https://*'

    processors:
      batch: {}
      resource:
        attributes:
          - key: deployment.environment.name
            value: 'production'
            action: upsert
          - key: property
            value: 'mastodon.social'
            action: upsert
          - key: git.commit.sha
            from_attribute: vcs.repository.ref.revision
            action: insert
          - key: git.repository_url
            from_attribute: vcs.repository.url.full
            action: insert
      k8sattributes:
        auth_type: 'serviceAccount'
        passthrough: false
        extract:
          metadata:
            - k8s.namespace.name
            - k8s.pod.name
            - k8s.pod.start_time
            - k8s.pod.uid
            - k8s.deployment.name
            - k8s.node.name
          labels:
            - tag_name: app.label.component
              key: app.kubernetes.io/component
              from: pod
        pod_association:
          - sources:
              - from: resource_attribute
                name: k8s.pod.ip
          - sources:
              - from: resource_attribute
                name: k8s.pod.uid
          - sources:
              - from: connection
      resourcedetection:
        detectors: [system]
        system:
          resource_attributes:
            os.description:
              enabled: true
            host.arch:
              enabled: true
            host.cpu.vendor.id:
              enabled: true
            host.cpu.family:
              enabled: true
            host.cpu.model.id:
              enabled: true
            host.cpu.model.name:
              enabled: true
            host.cpu.stepping:
              enabled: true
            host.cpu.cache.l2.size:
              enabled: true
      transform:
        error_mode: ignore

        # Proper code function naming
        trace_statements:
          - context: span
            conditions:
              - attributes["code.namespace"] != nil
            statements:
              - set(attributes["resource.name"],
                Concat([attributes["code.namespace"],
                attributes["code.function"]], "#"))

          # Proper kubernetes hostname
          - context: resource
            conditions:
              - attributes["k8s.node.name"] != nil
            statements:
              - set (attributes["k8s.node.name"],
                Concat([attributes["k8s.node.name"], "k8s-1"], "-"))
        metric_statements:
          - context: resource
            conditions:
              - attributes["k8s.node.name"] != nil
            statements:
              - set (attributes["k8s.node.name"],
                Concat([attributes["k8s.node.name"], "k8s-1"], "-"))
        log_statements:
          - context: resource
            conditions:
              - attributes["k8s.node.name"] != nil
            statements:
              - set (attributes["k8s.node.name"],
                Concat([attributes["k8s.node.name"], "k8s-1"], "-"))
      attributes/sidekiq:
        include:
          match_type: strict
          attributes:
            - key: messaging.sidekiq.job_class
        actions:
          - key: resource.name
            from_attribute: messaging.sidekiq.job_class
            action: upsert
      tail_sampling:
        policies:
          [
            {
              name: errors-policy,
              type: status_code,
              status_code: { status_codes: [ERROR] },
            },
            {
              name: randomized-policy,
              type: probabilistic,
              probabilistic: { sampling_percentage: 0.1 },
            },
          ]

    connectors:
      datadog/connector:
        traces:
          compute_stats_by_span_kind: true

    exporters:
      datadog:
        api:
          site: ${DD_SITE}
          key: ${DD_API_KEY}
        traces:
          compute_stats_by_span_kind: true
          trace_buffer: 500

    service:
      pipelines:
        traces/all:
          receivers: [otlp]
          processors:
            [
              resource,
              k8sattributes,
              resourcedetection,
              transform,
              attributes/sidekiq,
              batch,
            ]
          exporters: [datadog/connector]
        traces/sample:
          receivers: [datadog/connector]
          processors: [tail_sampling, batch]
          exporters: [datadog]
        metrics:
          receivers: [datadog/connector, otlp]
          processors:
            [resource, k8sattributes, resourcedetection, transform, batch]
          exporters: [datadog]
        logs:
          receivers: [otlp]
          processors:
            [
              resource,
              k8sattributes,
              resourcedetection,
              transform,
              attributes/sidekiq,
              batch,
            ]
          exporters: [datadog]
Staying up to date
Mastodon typically upgrades the OpenTelemetry Collector within a day or two of each release.
“Everything is documented, and all breaking changes are properly detailed,” Tim noted, praising the clarity of the release notes.
While frequent releases sometimes introduce breaking changes, the team views this as a sign of healthy and active development—as long as you stay current.
Lessons and pain points
The most challenging part of the journey was simply getting started. Understanding how the Collector’s components fit together took time, especially for a team without dedicated observability specialists. More recently, the biggest complexity has come from advanced use of the transform processor, particularly when adapting span attributes for backend-specific naming requirements.
transform:
  error_mode: ignore

  # Proper code function naming
  trace_statements:
    - context: span
      conditions:
        - attributes["code.namespace"] != nil
      statements:
        - set(attributes["resource.name"], Concat([attributes["code.namespace"],
          attributes["code.function"]], "#"))
In the transform processor rule above, they have configured a condition to set
resource.name (a Datadog specific attribute) to the value of
code.namespace#code.function. With that set, whenever the span arrived at the
backend, it was able to map to the name they had defined. Despite that learning
curve, the overall experience has exceeded expectations.
“You can basically do anything you want. It went beyond my expectations. Everything works pretty well.”
That reliability and flexibility are the reasons why Mastodon continues to use the OpenTelemetry Collector in production.
Advice for small teams
Based on Mastodon’s experience, a few lessons stand out:
- Keep the architecture simple: one Collector can go a long way
- Rely on Kubernetes operators for lifecycle management
- Use sampling to control cost
- Stick to semantic conventions to avoid long-term lock-in
- Upgrade frequently to reduce the pain of breaking changes
What’s next
Mastodon’s story shows that even a very small team can successfully operate OpenTelemetry Collectors in production—at global scale—without significant operational burden.
This is just the first story in the series.
In upcoming posts, we’ll explore how medium and large organizations deploy and operate the OpenTelemetry Collector, manage instrumentation across services, and how their challenges—and solutions—change with scale.
If you’re running OpenTelemetry in production and want to share your experience, join the CNCF #otel-devex Slack channel. We’d love to hear your story—and learn how we can keep improving the OpenTelemetry developer experience together.