How Skyscanner scales OpenTelemetry: managing collectors across 24 production clusters
The Developer Experience SIG is publishing a series of blog posts featuring real-world OpenTelemetry deployments from companies across different industries and scales. This post features Skyscanner, a global travel search platform based in Edinburgh, Scotland.
With 1,400 employees worldwide running over 1,000 microservices across 24 production Kubernetes clusters, Skyscanner’s journey with OpenTelemetry offers valuable lessons for organizations operating at scale.
Organizational structure
The Hubble team, consisting of six platform engineers, manages most of Skyscanner’s collectors. As part of the wider platform engineering organization, they handle the compute platform that runs Skyscanner’s primarily Java-based microservices architecture.
Service teams themselves remain abstracted from the deployment and telemetry collection infrastructure. For Java services, teams inherit a base Docker image containing the pre-configured OpenTelemetry Java agent. For Python and Node.js services, the platform team provides wrapper libraries that set sensible defaults based on environment and resource attributes. These approaches minimize boilerplate setup and give service teams observability out of the box without requiring deep OpenTelemetry knowledge.
OpenTelemetry adoption
Skyscanner’s OpenTelemetry journey began in 2021. The company was migrating from an internally built open source stack to a commercial vendor. However, they wanted to avoid vendor lock-in.
“We wanted to move to a vendor in a way that was vendor agnostic,” explained Neil Fordyce, Software Engineer on Skyscanner’s Hubble platform team.
This vendor-agnostic approach led them to adopt the OpenTelemetry Collector as the central piece of their telemetry infrastructure.
Architecture: centralized routing, distributed collection
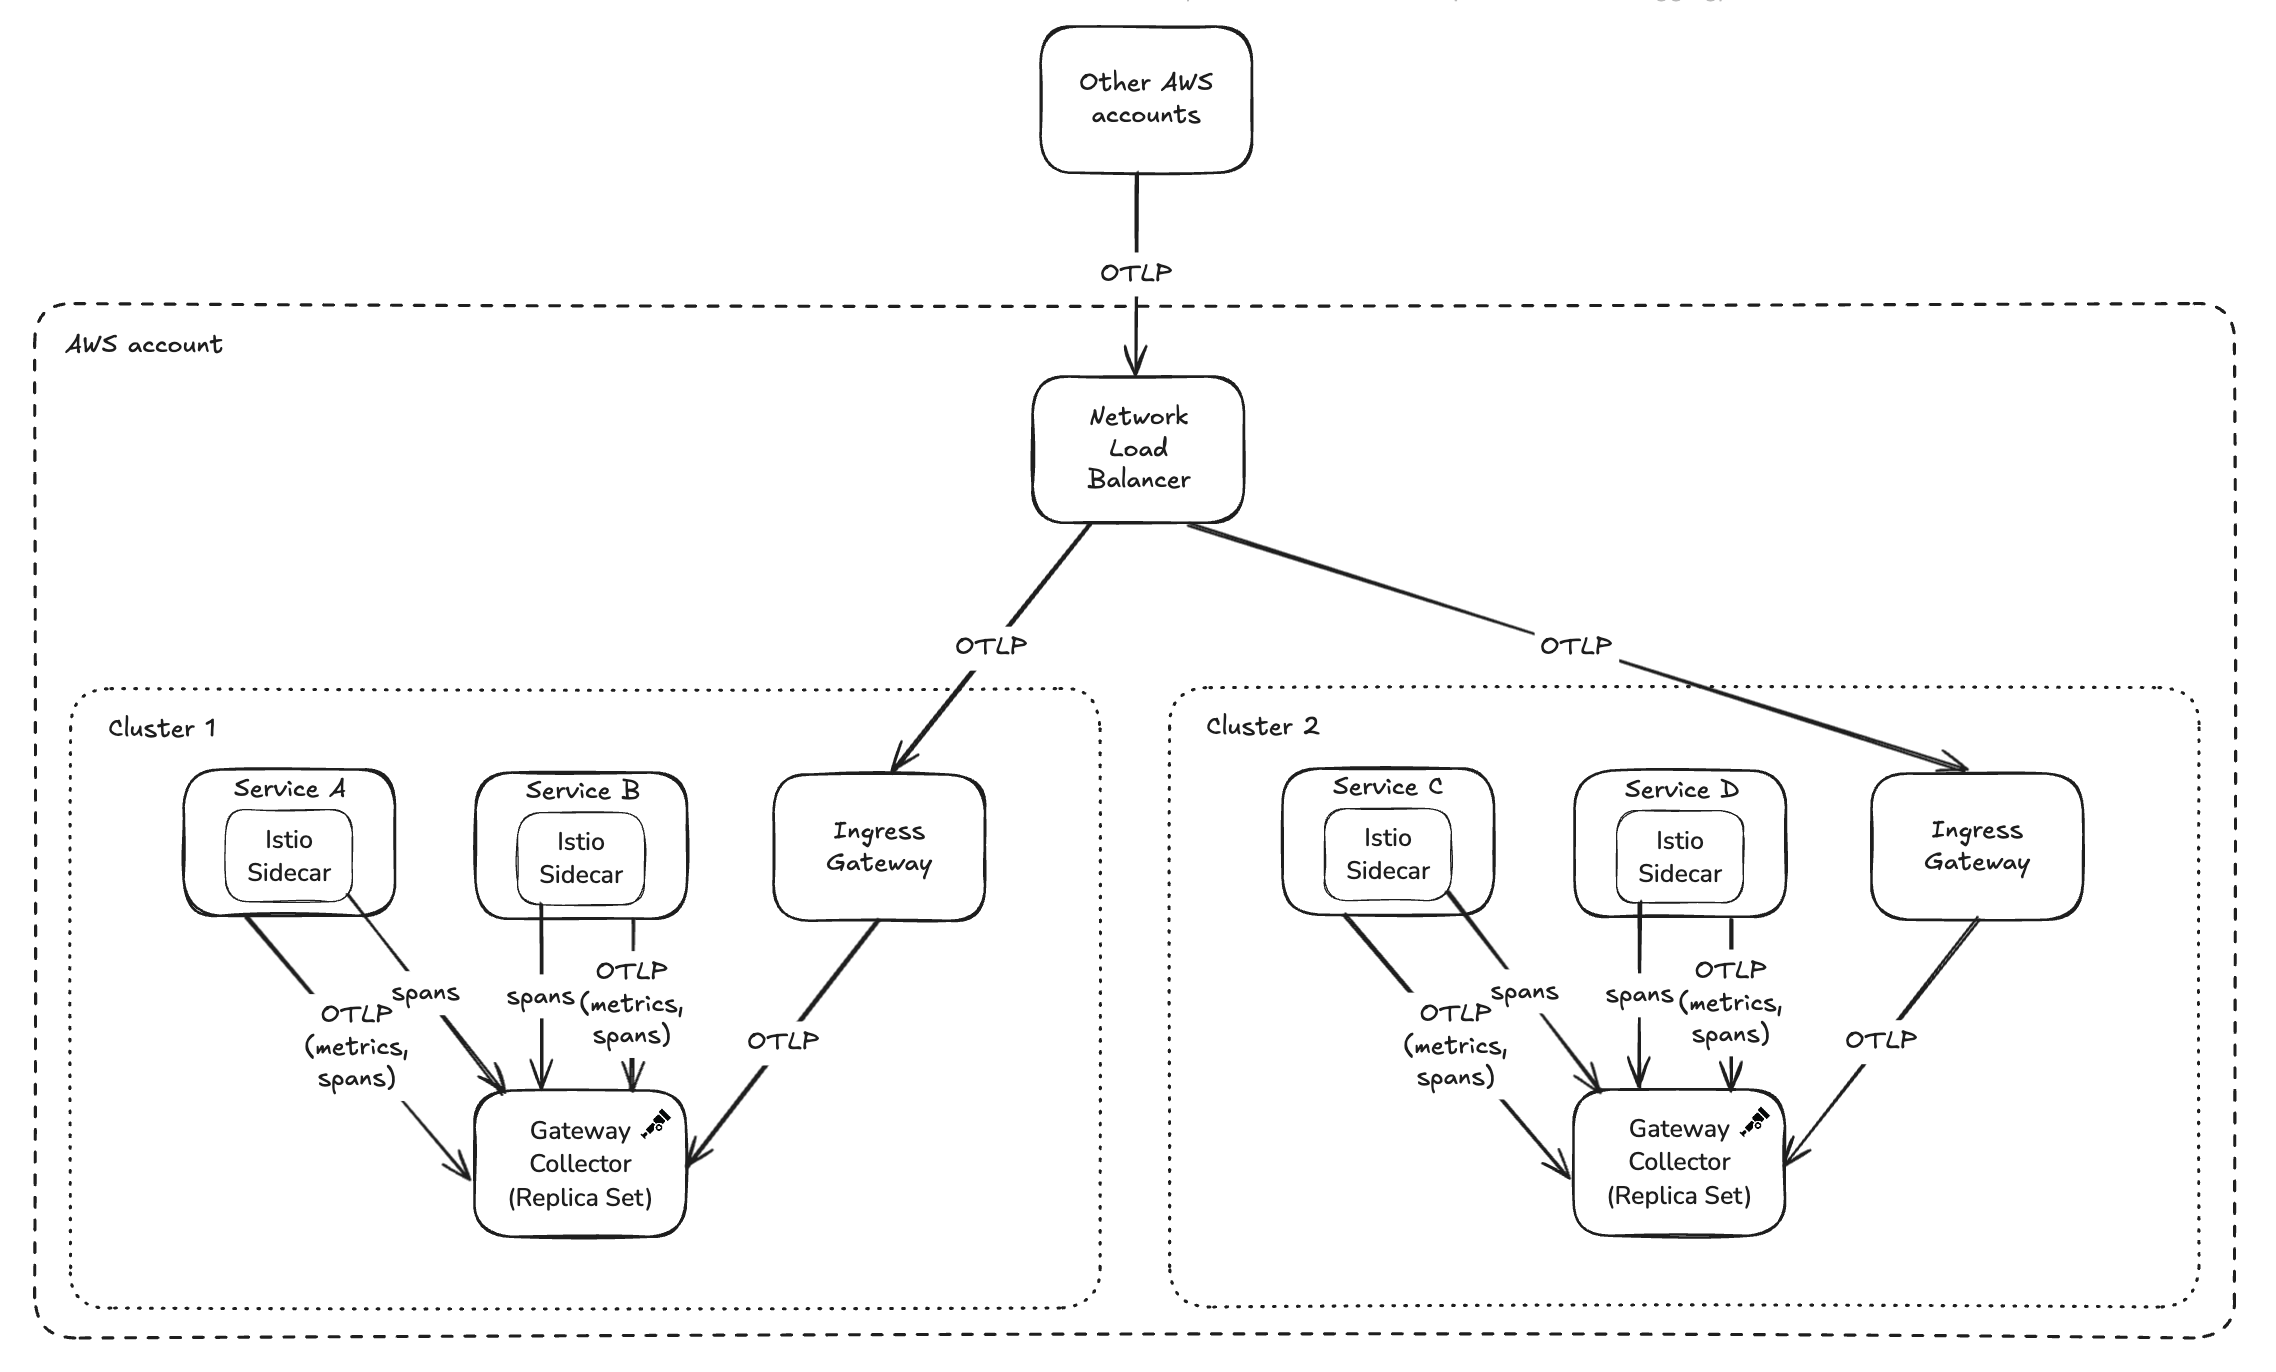
Skyscanner’s collector architecture features a central DNS endpoint with Istio-based intelligent routing. Regardless of where services run globally or which cluster they’re in, they send telemetry to this single address. Istio handles routing requests to the nearest available collector.
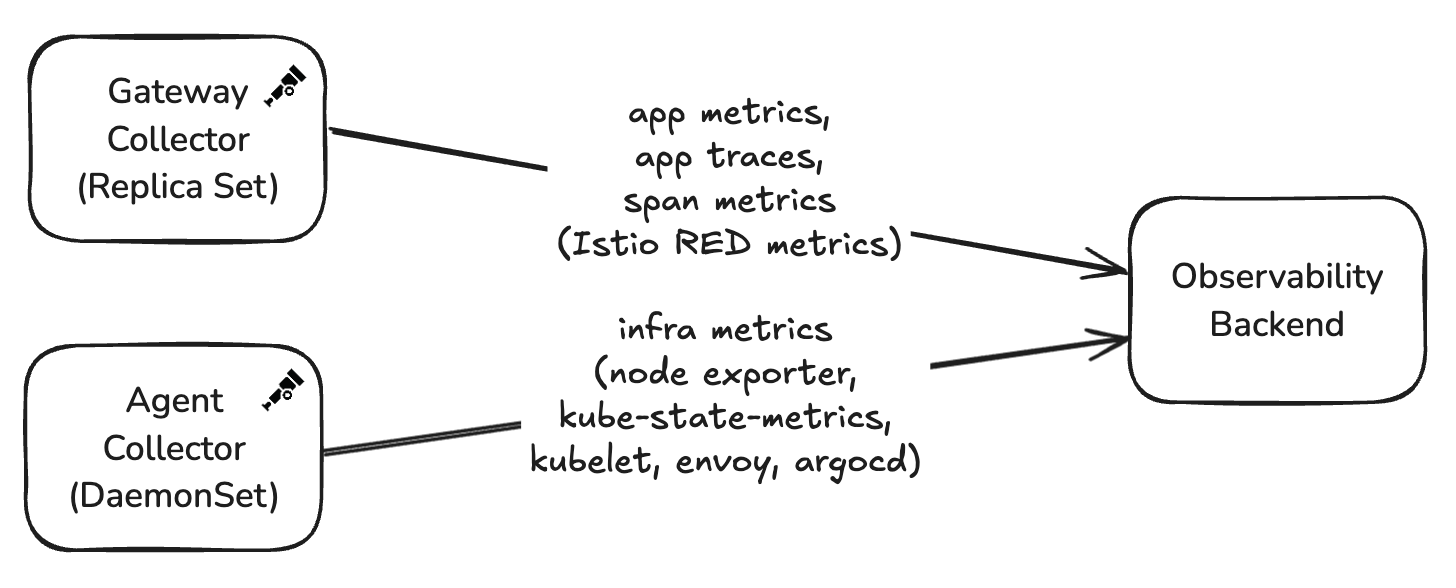
The deployment consists of two distinct collector patterns:
Gateway Collector (Replica Set): Handles bulk OTLP traffic (traces and metrics) from most services, where the majority of processing happens.
Agent Collector (DaemonSet): Scrapes Prometheus endpoints from open source and platform services that don’t yet support OTLP natively.
Configuration: start simple, evolve gradually
When Skyscanner first deployed collectors in 2021, their configuration was minimal: memory limiter, batch processor, and an OTLP exporter for traces.
Over time, the configuration evolved organically: adding metrics pipelines, integrating Istio span ingestion, implementing span-to-metrics transformation, and adding filter processors to reduce noise and control costs.
Turning Istio service mesh spans into platform metrics
One of Skyscanner’s most innovative uses of the collector involves generating metrics from Istio service mesh spans.
Istio’s native metrics suffered from cardinality explosion issues that would overwhelm their Prometheus deployment. Additionally, Skyscanner operates many off-the-shelf services where they don’t own the code but still need consistent metrics.
Their solution: Configure Istio to emit spans (originally in Zipkin format, though Istio now supports OTLP), ingest them through the collector with the Zipkin receiver, transform them to meet semantic conventions, and use the span metrics connector to generate consistent metrics without any application instrumentation.
“We can do that at a platform level without the application owners having to instrument their code at all,” Neil noted.
The span metrics connector configuration extracts key dimensions from the spans:
connectors:
  spanmetrics:
    aggregation_temporality: AGGREGATION_TEMPORALITY_DELTA
    dimensions:
      - name: http.status_code
      - name: grpc.status_code
      - name: rpc.service
      - name: rpc.method
      - name: prot
      - name: flag
      - name: k8s.deployment.name
      - name: k8s.replicaset.name
      - name: destination_subset
    dimensions_cache_size: 15000000
    histogram:
      exponential:
        max_size: 160
      unit: ms
    metrics_flush_interval: 30s
The collector then transforms these metrics to use semantic convention names
like http.client.duration and http.server.duration, aggregating them by
cluster, service name, and HTTP status code. This provides platform-level HTTP
metrics for every service without code changes, consistent naming adhering to
semantic conventions, and lower cardinality than native Istio metrics.
The 404 error challenge
One notable challenge with the collector configuration involved cache services that returned HTTP 404 to indicate that an entry did not exist in the cache. The collector treated these 404s as errors, triggering 100% trace sampling for what was actually normal, high-volume behavior.
The solution was adding a filter processor to unset the error status for these specific 404 responses:
processors:
  span/unset_cache_client_404:
    include:
      attributes:
        - key: http.response.status_code
          value: ^404$
        - key: server.address
          value: ^(service-x\.skyscanner\.net|service-y\.skyscanner\.net|service-z\.skyscanner\.net|service-z-\w{2}-\w+-\d\.int\.\w{2}-\w+-\d\.skyscanner\.com)$
      match_type: regexp
      regexp:
        cacheenabled: true
        cachemaxnumentries: 1000
    status:
      code: Unset
This processor matches spans with 404 status codes from specific cache services and unsets their error status, preventing them from triggering error-based sampling.
“We’d have had higher-quality, easier-to-use traces if we had that filter processor from the start,” Neil reflected.
However, Neil notes that with the recent introduction of OpenTelemetry SDK declarative configuration, such filtering could now be configured in a decentralized fashion by the service teams themselves, rather than requiring changes to the central collector configuration.
Configuration deep dive
Skyscanner has shared their production collector configurations to help others understand these patterns in practice:
Gateway collector
The gateway collector handles the bulk of processing:
- Receives OTLP metrics and traces from services and Zipkin spans from Istio
- Uses the span metrics connector to generate metrics from Istio spans
- Employs extensive transform processors to map Istio attributes to semantic conventions
- Implements the 404 filtering logic for cache services
- Exports metrics and traces to the observability vendor via OTLP
The diagram illustrates how OTLP metrics and traces, as well as Istio spans, reach these gateway collectors:
Agent collector
The agent collector focuses on collecting infrastructure and platform-level metrics from each node:
- Scrapes Prometheus endpoints from various sources (node exporter, kube-state-metrics, kubelet)
- Performs minimal processing (memory limiting, batching, attribute cleanup)
- Exports metrics to the observability vendor via OTLP
Instrumentation strategy
Skyscanner’s Java-heavy environment benefits significantly from OpenTelemetry’s auto-instrumentation capabilities. The Java agent, pre-configured in base Docker images, provides HTTP and gRPC span generation out of the box.
Opinionated auto-instrumentation
The team takes a deliberately opinionated approach to auto-instrumentation. Rather than enabling everything by default, they start from the opposite direction: all instrumentations are disabled in a shared base Docker image, and only a curated set is explicitly enabled.
“It’s sort of the other way around. We disable everything, then enable what we need,” Neil explained.
Using environment variables in the base image, Skyscanner enables a focused set of runtime-, HTTP-, and gRPC-related instrumentations by default. This includes JAX-RS, gRPC, Jetty, common HTTP clients, executor instrumentation, and logging context propagation. Service teams inherit these defaults automatically but remain free to override them or enable additional instrumentations in their own service definitions if needed.
This model ensures consistency across hundreds of services while still allowing flexibility at the edges.
Setting up the Java agent
The snippet below is an illustration of the shared Java base image. It bundles the OpenTelemetry Java agent into the image, sets organization-wide defaults, and installs a common launcher script:
# Image used as source for the OpenTelemetry Java agent
FROM ghcr.io/open-telemetry/opentelemetry-operator/autoinstrumentation-java:2.25.0 AS otel

# Define a common base image for all Java microservices to extend
FROM image/registry/public-java-image:x.y.z

# Copy OpenTelemetry Java agent from OTel image
COPY --from=otel /javaagent.jar $OPEN_TELEMETRY_DIRECTORY/opentelemetry-javaagent.jar
ENV OTEL_AGENT=$OPEN_TELEMETRY_DIRECTORY/opentelemetry-javaagent.jar

# Pick sensible defaults for everyone in the org
ENV OTEL_METRICS_EXPORTER="otlp"
ENV OTEL_TRACES_EXPORTER="otlp"
ENV OTEL_LOGS_EXPORTER="none"
ENV OTEL_EXPORTER_OTLP_METRICS_TEMPORALITY_PREFERENCE="DELTA"
ENV OTEL_EXPERIMENTAL_METRICS_VIEW_CONFIG="otel-view.yaml"
ENV OTEL_EXPORTER_OTLP_ENDPOINT="http://otel.skyscanner.net"
ENV OTEL_INSTRUMENTATION_COMMON_DEFAULT_ENABLED="false"
ENV OTEL_INSTRUMENTATION_RUNTIME_TELEMETRY_ENABLED="true"
ENV OTEL_INSTRUMENTATION_ASYNC_HTTP_CLIENT_ENABLED="true"
ENV OTEL_INSTRUMENTATION_APACHE_HTTPCLIENT_ENABLED="true"

COPY run.sh /usr/bin/run.sh
That launcher script run.sh constructs the -javaagent flags and
otel.resource.attributes from environment variables the deployment supplies:
# We use this to setup OTel resource attributes
# for things we can detect from environment variables on service launch
# These vars are set automatically by our deployment system
# Some env vars have been omitted to avoid repetition
setup_otel_agent() {
   if [[ -n "$AWS_REGION" ]]; then CLOUD_REGION="cloud.region=${AWS_REGION},"; else CLOUD_REGION=""; fi
   if [[ -n "$AWS_ACCOUNT" ]]; then CLOUD_ACCOUNT_ID="cloud.account.id=${AWS_ACCOUNT},"; else CLOUD_ACCOUNT_ID=""; fi
   if [[ -n "$CLUSTER_NAME" ]]; then K8S_CLUSTER_NAME="k8s.cluster.name=${CLUSTER_NAME},"; else K8S_CLUSTER_NAME=""; fi
   if [[ -n "$SERVICE" ]]; then SERVICE_NAME="service.name=${SERVICE}"; else SERVICE_NAME=""; fi
   echo -n "-javaagent:$OTEL_AGENT" \
       "-Dotel.resource.attributes=${CLOUD_REGION}${CLOUD_ACCOUNT_ID}${K8S_CLUSTER_NAME}${SERVICE_NAME}"
}

JAVA_OPTS="-D64 -server -showversion $(setup_otel_agent) ${ADDITIONAL_JAVA_OPTS:-}"

exec java $JAVA_OPTS "$@"
Finally, an individual service Dockerfile extends the same base and only adds the extra instrumentations that service needs:
FROM image/registry/skyscanner-java-base:x.y.z

COPY my-service.jar

# It's easy to extend if my-service wants to enable some other non-default instrumentation
ENV OTEL_INSTRUMENTATION_OPENAI_ENABLED=true
ENV OTEL_INSTRUMENTATION_OKHTTP_ENABLED=true

CMD exec /usr/bin/run.sh -jar my-service.jar server
Spans yes, metrics no (by default)
A particularly interesting aspect of Skyscanner’s strategy is how they treat metrics versus traces. Although HTTP and gRPC instrumentations are enabled, the team deliberately drops most SDK-generated HTTP and RPC metrics. This is because they already derive consistent, lower-cardinality platform metrics from Istio service mesh spans, as described earlier.
Rather than disabling the instrumentations entirely—which would also remove spans—they use OpenTelemetry SDK views to drop the metric aggregations while preserving tracing:
- HTTP and RPC metrics are dropped globally
- Spans continue to be emitted as normal
- Service teams can selectively re-enable specific metrics (for example, server-side latency) if they need additional granularity beyond what Istio provides
When teams do opt back into SDK metrics, they often rename them to avoid clashing or double-counting with existing Istio-derived metrics.
In the Java base image shown earlier,
OTEL_EXPERIMENTAL_METRICS_VIEW_CONFIG points to Skyscanner’s default
otel-view.yaml, using
view file configuration:
# Default Skyscanner metrics view config
# Stored in a file which OTEL_EXPERIMENTAL_METRICS_VIEW_CONFIG points to
# Drop http and rpc metrics, because we have metrics from Istio already
# We still want tracing to work so we wouldn't just disable the instrumentation
- selector:
    instrument_name: http.*
  view:
    aggregation: drop
- selector:
    instrument_name: rpc.*
  view:
    aggregation: drop
The same file can be extended when a service needs to keep specific metrics. A
typical use case is breaking down requests by http.route:
# This dropping behaviour can be altered by extending the list to add more views
# to explicitly select the metrics to be kept.
# e.g. to keep http.server.request.duration metrics,
# but continue to drop http.client.* metrics
- selector:
    instrument_name: http.server.request.duration
  view:
    # renamed because we already have Istio metrics named http.server.request.duration,
    # so don't want to clash and double count
    name: app.http.server.request.duration
    attribute_keys:
      - http.request.method
      - http.route
      - http.response.status_code
This approach allows Skyscanner to keep high-value distributed traces, avoid metric duplication, control cardinality, and reduce ingestion costs—all without requiring service owners to deeply understand OpenTelemetry internals.
Overall, the strategy reflects a strong platform mindset: provide sensible defaults that work at scale, minimize noise, and make the “right thing” the easy thing, while still leaving room for teams with advanced needs to go further.
Deployment and release management
Skyscanner uses the OpenTelemetry Collector Contrib distribution, having adopted it because it included everything they needed. The team learned during the interview that Contrib isn’t recommended for production use, and plans to explore building custom collector images with only the components they need.
Skyscanner updates collectors approximately every six months, though they’ll upgrade more frequently if tracking specific features or critical fixes. They follow RSS feeds and CNCF Slack channels to stay informed about releases.
Their rollout strategy uses progressive promotion across cluster tiers: Dev clusters, then three Alpha production clusters, followed by eight Beta production clusters, and finally the remaining 13 production clusters. Using Argo CD for deployment, changes are promoted via pull requests between tiers.
“We’ve definitely messed stuff up in the development testing clusters and then gone and fixed them before promoting further,” Neil said.
This gradual approach has caught configuration issues before they reach production. While they don’t yet have automated testing and rollback capabilities for their OpenTelemetry Collector deployments, these improvements are on the horizon.
What works well
Since adopting OpenTelemetry in production, the team’s experience has been very positive.
“It genuinely has been quite pain-free,” Neil reflected.
The flexibility stands out as the collector’s greatest strength.
“Everything that we’ve set out to do, we’ve been able to actually deliver. I think that speaks to how flexible it is,” Neil explained.
Other highlights include the OTLP protocol providing vendor independence through simple configuration, clear and well-organized release notes, and community responsiveness when team members discovered and contributed fixes for a memory leak in a collector component.
Lessons and pain points
Skyscanner still uses older, unstable HTTP semantic conventions in some pipelines. Upgrading requires updating multiple transform processor rules that map Istio attributes to semantic convention names, which involves manually cross-referencing documentation and filling out configuration strings.
The team is aware of Weaver for semantic convention management but hasn’t yet integrated it into their workflow.
Upgrading every six months means encountering multiple breaking changes at once. While the release notes are well-written and clearly document changes, reviewing six months of updates at once adds friction compared to keeping pace with releases.
Advice for others
Based on their production experience, the Skyscanner team offers this advice:
- Start simple: Begin with just the memory limiter, batch processor, and basic exporters. Add complexity only as needs arise.
- Memory limiter from day one: Set this up immediately to prevent memory issues as you scale.
- Consider filter processors early: Understand your application’s status code semantics and filter out high-volume “false positives” to control costs.
- Don’t over-engineer resiliency: For telemetry data, simple in-memory batching is often sufficient.
- Gradual rollouts catch issues: Progressive promotion across environment tiers provides valuable validation.
What’s next
This story demonstrates that platform engineering teams of modest size can successfully manage OpenTelemetry Collector infrastructure at significant scale with relatively low operational overhead.
Stay tuned for more stories in this series, where we’ll continue exploring how organizations of different sizes leverage the OpenTelemetry Collector in production, each with unique challenges and creative solutions.
Have your own OpenTelemetry Collector story to share? Join us in the CNCF #otel-devex Slack channel. We’d love to hear how you’re using OpenTelemetry in production and how we can continue improving the developer experience.