Exploring the OpenTelemetry Instrumentation Ecosystem
OpenTelemetry has a lot of pieces: APIs, SDKs, a protocol, semantic conventions, instrumentation, and tools like the Collector. The APIs and protocol define how telemetry is created and exchanged, while instrumentation is what actually observes what happens inside an application and turns it into telemetry. Semantic conventions give the people writing that instrumentation a shared way to describe what they’re observing.
The beauty of this approach is that completely separate authors can instrument different libraries, in different languages, and still produce telemetry that follows the same contract. An HTTP request looks like an HTTP request, regardless of which library or language produced it. Users can then build queries, dashboards, and other tooling around that shared understanding. Once we’ve agreed on the conventions, everything should line up.
Except it doesn’t, not yet anyway.
Conventions evolve, and domains take years to stabilize. HTTP entered the specification in June 2019 and its core conventions didn’t reach stable until November 2023. Database started at around the same time and didn’t get there until May 2025.
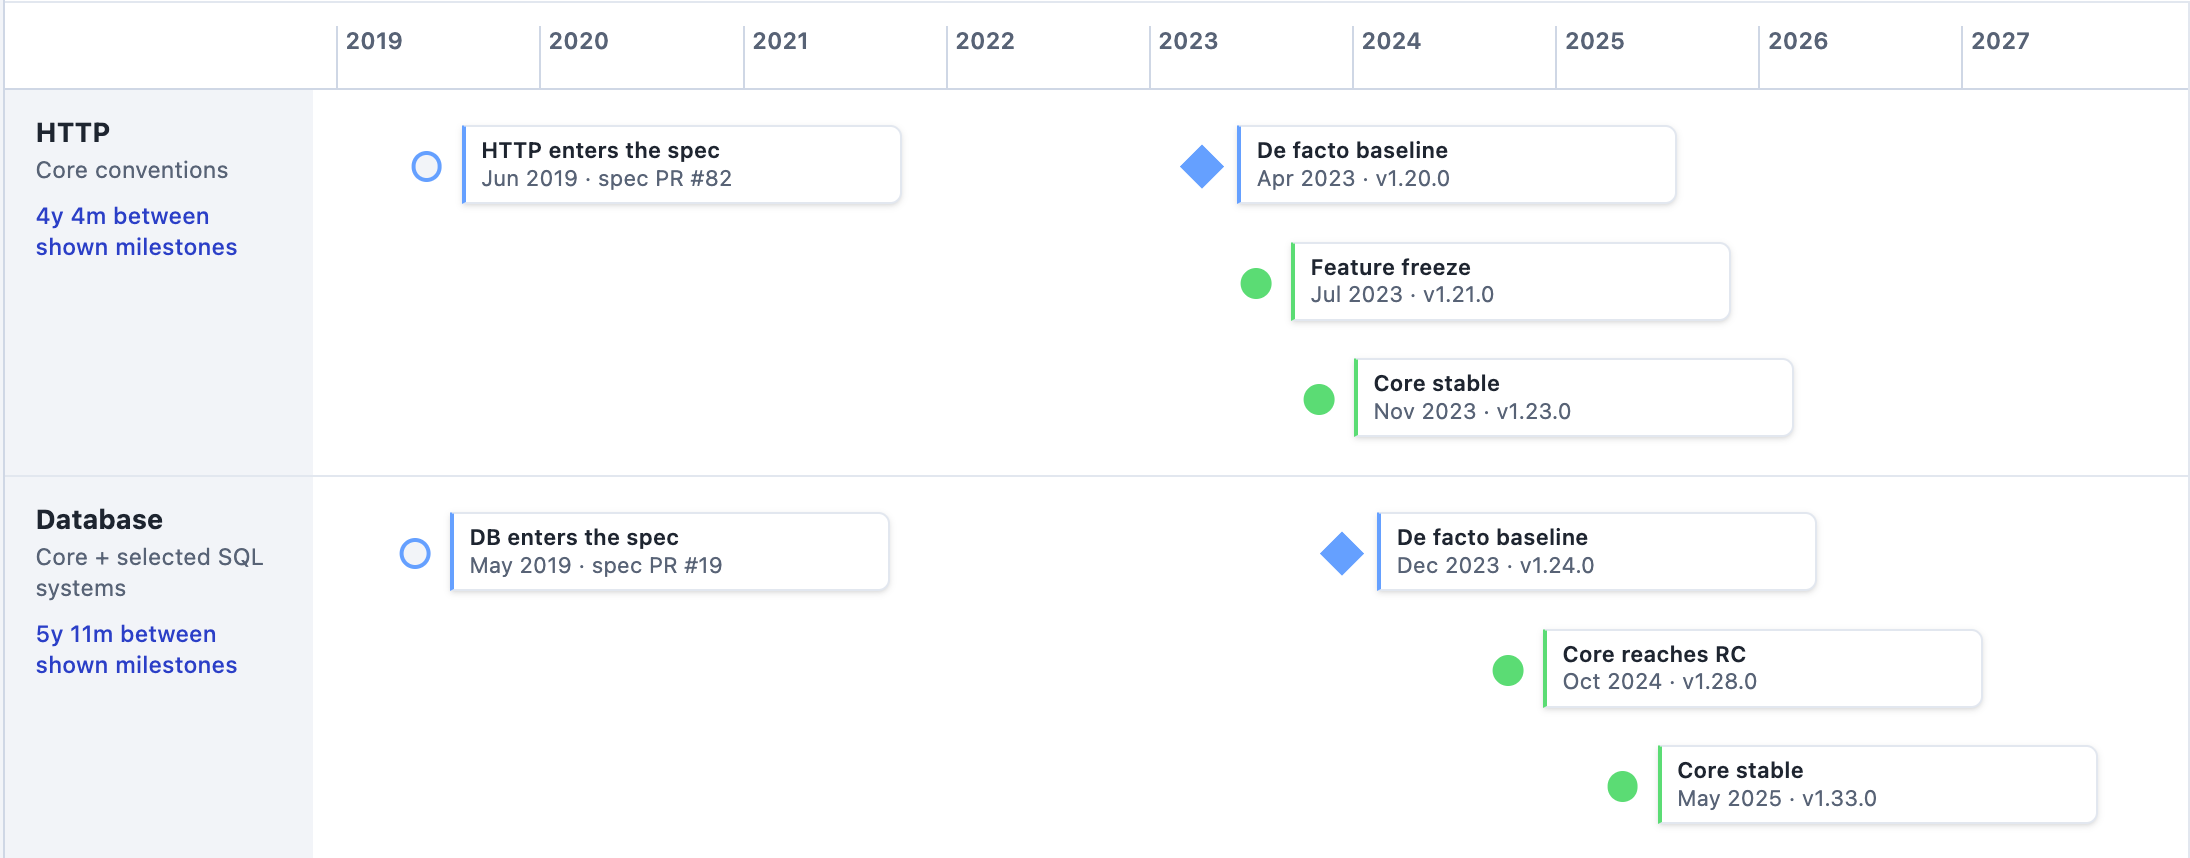
Timeline of the HTTP and database semantic conventions, from entering the specification to a stable set of core conventions.
The instrumentation libraries across the ecosystem then have to catch up, which makes a stable convention more of a starting point rather than a finish line. Publishing a convention doesn’t automatically update the code that implements it, and reading the convention won’t tell you which libraries have made the change. Even inspecting the instrumentation can be tricky: what it emits can depend on configuration and on what the application actually does.
When a convention stabilizes, how quickly do implementations follow? Where are we still missing an attribute or a metric? Those are hard questions to answer without going through the instrumentation and checking what it produces. And before we can do that systematically, we need to know what components exist and what each one is supposed to do.
The OpenTelemetry Ecosystem Explorer is a website that catalogs the components in the OpenTelemetry ecosystem and describes what each one does. You can browse the Java agent and the Collector today, with detailed component information and release comparisons. For Java instrumentation, you can choose a version and see its described telemetry alongside its configuration options.
That’s what exists today. What we’re working towards is bringing measurements from the semantic-conventions-conformance project together with that component information, to show where implementations stand and to give maintainers and contributors a clear view of where they can focus their efforts.
What should I expect from this instrumentation?
Before adopting an instrumentation or upgrading it, you need to know what it will produce. Which spans and metrics does it describe? Which attributes come with them? Which signals require configuration, and what changed since the version you’re running?
Karimot Isiaka’s recent user research highlighted how people piece together these answers from documentation, repositories, and release notes. The Explorer brings that information together in a version-specific view. For Java instrumentation, you can inspect its described telemetry and configuration options, then compare releases to understand what an upgrade could change.
What happens when we look across implementations?
Knowing what one component describes is a start. To understand where implementations have fallen behind, we also need to exercise them and look at the telemetry they actually emit.
That’s what the semantic-conventions-conformance project does. It runs small test scenarios, collects the telemetry, and uses Weaver’s live-check feature to compare it with semantic conventions and declared expectations. The current results are published as JSON, which we can aggregate and analyze to see where implementations are missing attributes, metrics, or other expected signals.
There’s some care needed in how we present this. Not observing an attribute in one scenario isn’t the same as proving an instrumentation never emits it. An optional attribute can be absent without anything being wrong, and experimental or custom telemetry still needs to be visible.
The Java SIG is already using this to track progress towards the Java agent’s 3.0 release. The database conventions have stabilized, and we’ve made progress on RPC and messaging. The Java agent adopted stable HTTP conventions in 2.0, but the audit surfaced gaps that we fixed along the way. Seeing those gaps helps the SIG prioritize work and check its progress.
That example comes from one language. For HTTP clients, we can already look wider, because several languages have scenarios in the conformance project.
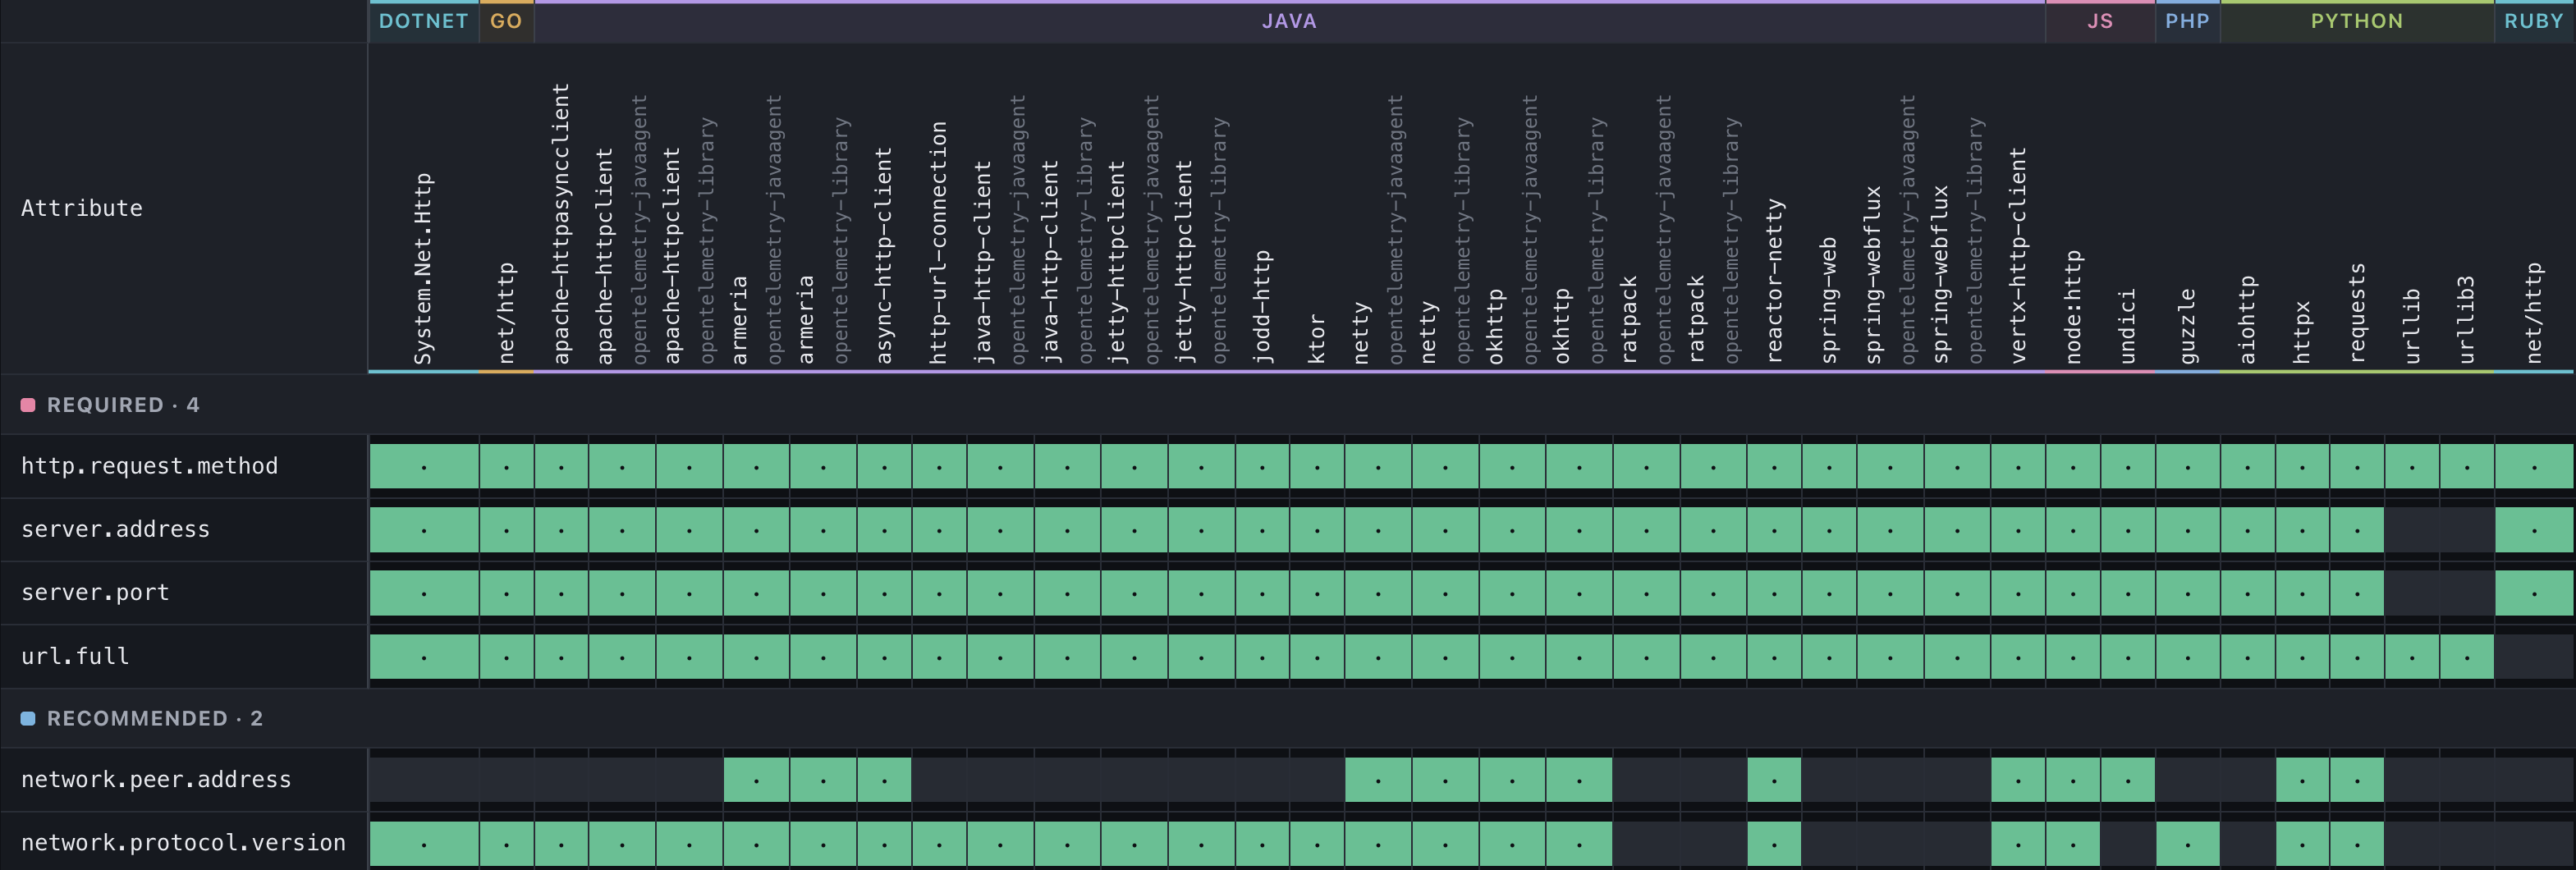
Selected HTTP client attributes observed in conformance test runs across seven languages, grouped by requirement level.
In this snapshot, the four required attributes shown were observed in nearly every tested instrumentation. The two recommended attributes shown were less consistently observed. An empty cell means an attribute wasn’t observed in these runs, not that the instrumentation can never emit it.
As more projects contribute structured metadata and repeatable measurements, we’d like the same picture for more domains: which gaps keep appearing across libraries? Where do we still lack the tests to know?
With repeated measurements tied to releases, we could also report on how that picture changes. A SIG could see which gaps its recent work has closed. Project leadership could identify areas where several SIGs need help with the same problem. Contributors could find work that would improve consistency across a whole instrumentation domain.
This kind of data would let us see the ecosystem as a whole: what works across OpenTelemetry, where progress is happening, and where help would make the biggest difference. For someone building a dashboard or a vendor integration, it could help answer whether they can rely on an attribute, need a fallback, or could contribute a fix.
The proposed OTel post-graduation roadmap calls for better instrumentation tooling, lower maintenance costs, and broader use of semantic-convention tooling across languages. We see making these gaps visible as one way the Explorer could contribute to those aims.
Today, these results live in the conformance project as reports from pinned runs, and connecting them to the Explorer’s components and releases is still ahead of us. We’d like users to be able to look at a component and see how its coverage has evolved and how it compares to other similar components.
Where does all this information come from?
A website can only show what we know. Collecting that knowledge, and keeping it current as the code changes, takes most of the work.
In Java, getting from basic metadata support to a populated instrumentation catalog took over a year. That work created structured information about the instrumentation that the Java project can use in its own documentation and catalogs, and the Explorer consumes and reuses.
We think that effort is worth making because the information is useful to the project itself. Some of it can be generated from code, some needs maintainers to describe intent and configuration, and some needs runtime checks to find out what really happens. Together, those sources give us a much better understanding of the instrumentation than any one of them alone.
This is also why we’d like to see more projects adopt OpenTelemetry Weaver. Weaver lets projects define their telemetry schemas in semantic-convention registries and use those definitions to generate documentation or code, and to check emitted telemetry. Even if a project starts with documentation alone, it has made its telemetry definitions structured and reusable. Code generation can build on that same starting point if and when it’s useful to the project.
For us, the value is having a common foundation for the telemetry part of this information. The definitions behind a project’s documentation can also inform validation and give consumers like the Explorer something structured to work with. Maintainers get value in their own workflow, and we have a clearer starting point for understanding the signals their components describe.
That still leaves other questions to answer. Which library versions does a component support? Which configuration enables a signal? What did a particular test actually observe? A telemetry registry is one part of that picture, alongside component metadata and runtime evidence.
Other ecosystems will have different starting points. We can work with their existing formats and tooling; Weaver adoption is something we encourage, but it is not necessarily a prerequisite for participation. The useful place to begin is with a component, the questions people have about it, and the information the project already has that could help answer them.
What about projects outside OpenTelemetry?
The same questions apply to libraries and projects maintained outside the OpenTelemetry organization. If a library describes itself as OpenTelemetry compatible or native, what can a user expect that to mean? How can the maintainers demonstrate it, and keep that information up to date?
For maintainers thinking about eventual inclusion in the Explorer, this is useful preparation. Define the telemetry your project intends to emit, describe the components and configuration that produce it, and make those descriptions available alongside your releases. A Weaver registry gives the telemetry definitions a reusable home. Pairing them with component metadata and repeatable checks would give us more to build on when bringing a project into the Explorer, and gives your users useful information in the meantime.
The ecosystem registry freeze brought this problem into focus recently. There were more submissions than maintainers had the time and tooling to validate, and listing a project wasn’t enough to tell users what its integration actually did.
In the long term, we’d like projects to be able to demonstrate specific claims with repeatable checks. Which signals do they emit? Which conventions do they follow? Does the telemetry from their test scenarios satisfy the applicable requirements? For someone else to reproduce a check, a report needs to include:
- the release under test
- the configuration options in effect, and what they do
- the scenarios that were run
- the semantic convention version checked against
Projects could run this as part of development and publish updated evidence with their releases.
The proposed OpenTelemetry Support Self-Assessment and Maintainer Guidance project describes a related goal: tools maintainers can run themselves, with guides for different kinds of projects. That proposal leaves results with maintainers of the projects, and if they choose to share them, we could explore making that evidence discoverable in the Explorer alongside component information.
There’s more work to do and things to figure out on third-party onboarding and acceptance criteria. The registry discussion names the Explorer as its eventual successor, but we’re not ready to take that on yet. The semantic-convention checks give us a good place to start, but there will certainly be a need for other compatibility claims, which will need their own checks.
Help us work through this
We have a published Java agent instrumentation catalog and workstreams in progress for other languages and components. What we still need to work through is how to make this information reusable across the ecosystem. We’d like to hear from other SIGs thinking about the same question: what evidence would actually be useful to their users?
If you maintain instrumentation, start with one component. What do its source, configuration, documentation, and tests already tell you? What could be generated, and what would need a runtime check? Bring that example to the Explorer project so we can work through how to make the information reusable. The conformance project is also a place to help with measuring emitted telemetry.
If you’re already defining your telemetry with Weaver, you have a useful starting point. Share your registry and an example component in an issue in the Explorer project, along with the questions you’d like the Explorer to help answer. Examples from different ecosystems will help us work out what integration should look like.