Inside the LLM Call: GenAI Observability with OpenTelemetry
Your AI agent just took 45 seconds to answer a simple question. Was it the model? A slow tool call? A retry loop? Every time an application calls an LLM, a chain of model calls, tool invocations, and token exchanges happens behind the scenes — and without observability, you are guessing.
The OpenTelemetry Semantic Conventions for Generative AI give you that visibility. They standardize how GenAI operations are recorded — the model being called, input and output token counts, and when opted in, the full content of prompts, completions, tool calls, and tool results.
This post walks through:
- Exporting GenAI telemetry from an LLM-powered app.
- Configuring an observability tool to receive and display that telemetry.
- Exploring GenAI traces, metrics, and events with a GenAI visualizer.
Exporting GenAI telemetry
For this walkthrough, we use VS Code Copilot to generate telemetry, since most developers already have it installed. However, many coding assistants support monitoring with OpenTelemetry:
- VS Code Copilot emits traces, metrics, and events for every agent interaction.
- OpenAI Codex exports structured log events and OTel metrics for API requests, tool calls, and sessions.
- Claude Code exports metrics and log events via OTel, with trace support in beta.
Beyond monitoring the tools you already use, you can add OpenTelemetry to your own GenAI-powered app to get insight into how it interacts with LLMs.
Configure telemetry export
Telemetry export requires a few settings. For
VS Code Copilot,
open Settings and search for copilot otel:
| Setting | Description | Value |
|---|---|---|
github.copilot.chat.otel.enabled | Enable OTel emission | true |
github.copilot.chat.otel.captureContent | Capture full prompt/response content | true |
github.copilot.chat.otel.otlpEndpoint | OTLP collector endpoint | "http://localhost:4318" (default, no change needed) |
By default, no prompt content or tool arguments are captured with GenAI telemetry, as these can contain sensitive data. Only metadata like model names, token counts, and durations are included. Enabling content capture populates span attributes with full prompt messages, system prompts, tool schemas, tool arguments, and tool results.
Exploring GenAI telemetry
Any OTLP-compatible backend can receive GenAI telemetry. For this walkthrough, we use the Aspire Dashboard — a free, open source telemetry viewer that ships as a Docker container. It accepts OTLP data directly and provides a built-in trace viewer, metrics explorer, and structured logs page — no cloud account required. It is well suited for local development and debugging of GenAI workloads.
Run the following Docker command to get started:
docker run --rm -p 18888:18888 -p 4317:18889 -p 4318:18890 -d --name aspire-dashboard \
    -e ASPIRE_DASHBOARD_UNSECURED_ALLOW_ANONYMOUS=true \
    mcr.microsoft.com/dotnet/aspire-dashboard:latest
The dashboard collects telemetry sent to http://localhost:4318, and you can
view telemetry by visiting http://localhost:18888. The dashboard also requires
authentication by default. Use
-e ASPIRE_DASHBOARD_UNSECURED_ALLOW_ANONYMOUS=true to allow anonymous access
during local development.
Explore traces
GenAI operations from VS Code Copilot are now recorded and observable. Ask Copilot a question in VS Code, then open the Traces page in the dashboard. You will see entries for each LLM interaction.
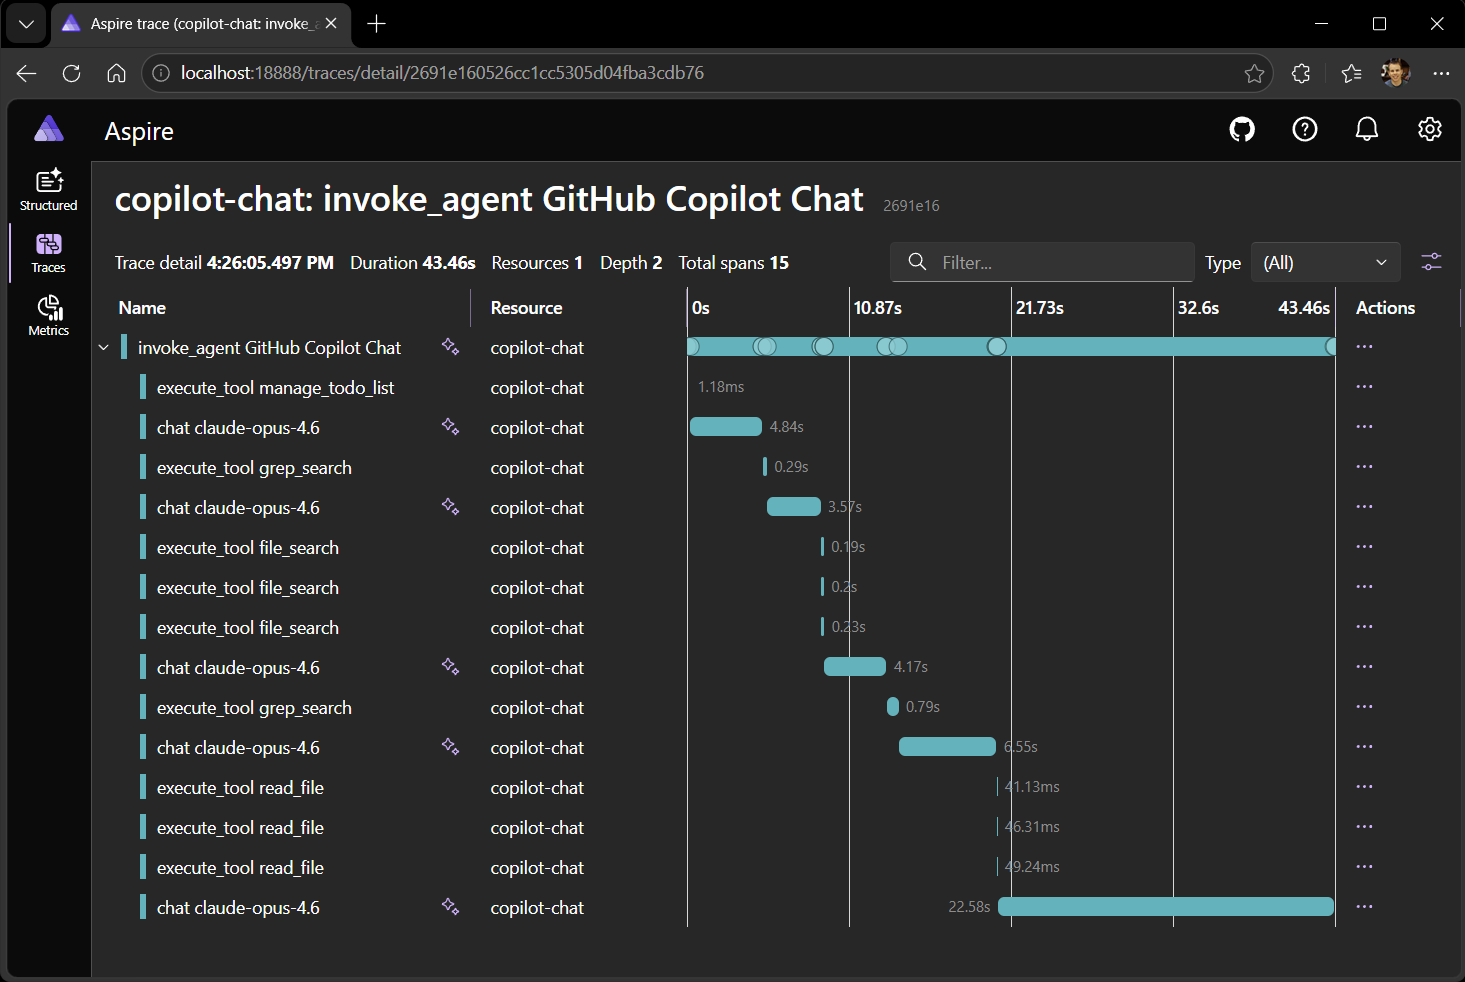
Selecting a trace reveals the span tree: the top-level invoke_agent span with
child chat spans for each LLM call and execute_tool spans for each tool
invocation.
The span details show GenAI semantic convention attributes:
gen_ai.request.model— the model used (for example,gpt-4o).gen_ai.usage.input_tokensandgen_ai.usage.output_tokens— token counts for each LLM call.gen_ai.response.finish_reasons— why the model stopped generating (for example,stoportool_calls).
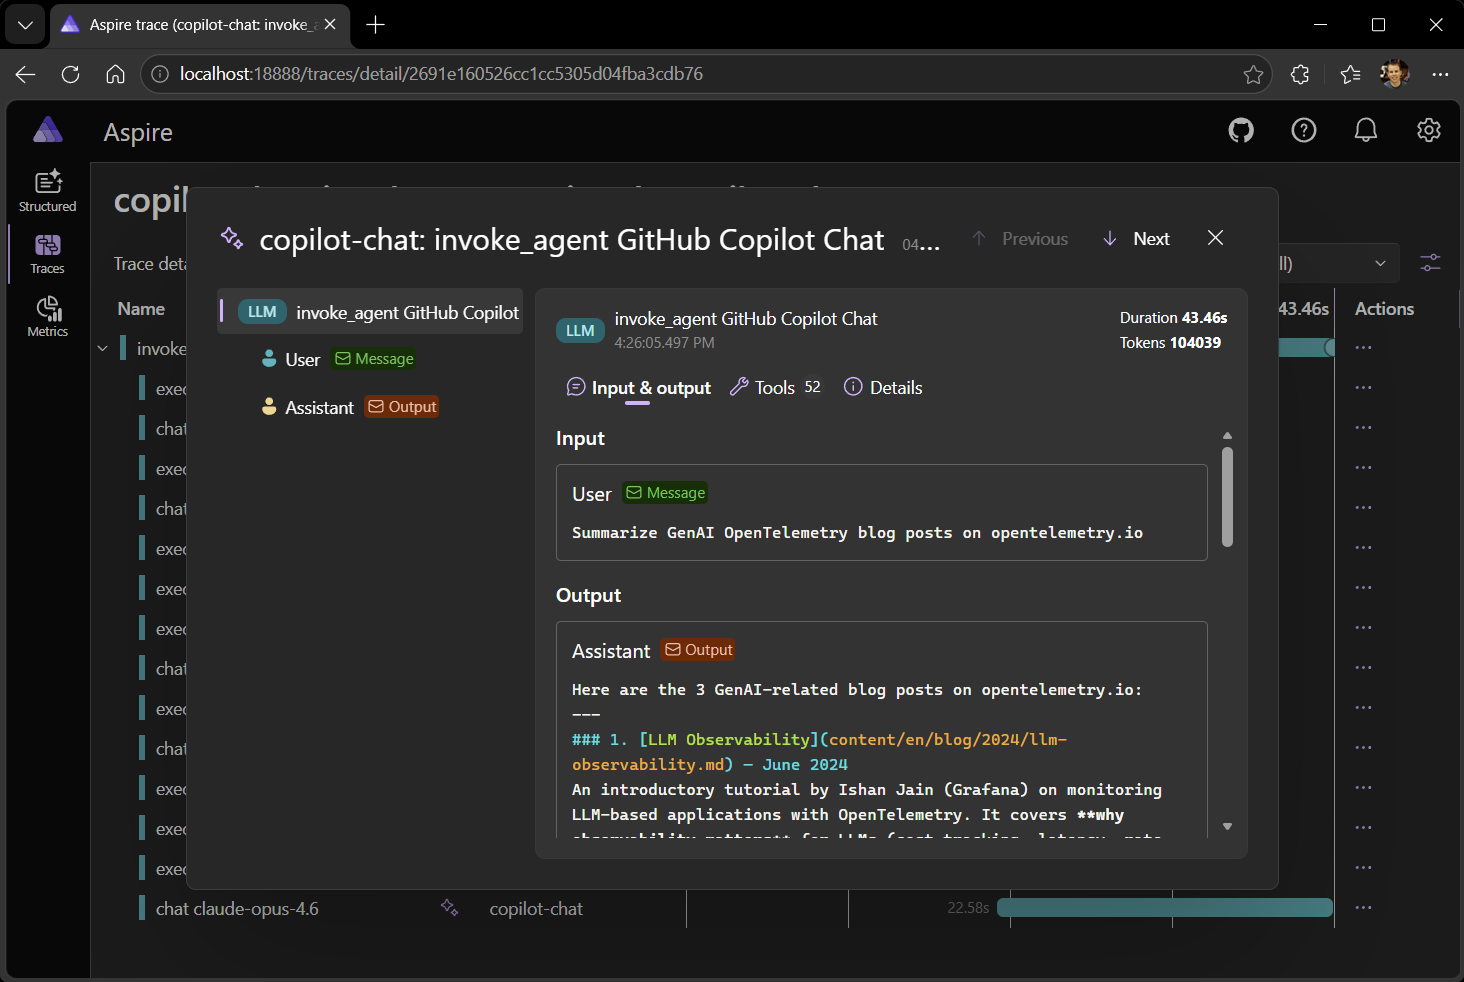
When an app is configured to record content, messages and tool calls are
captured as structured span attributes such as gen_ai.system_instructions,
gen_ai.input.messages, and gen_ai.output.messages. This content is valuable
for debugging, but these attributes can be large, and many observability
platforms render them as raw JSON, making them difficult to read.
Observability tools can include specialized UI for viewing GenAI telemetry. We’ll use a GenAI telemetry visualizer that parses these attributes and renders a chat-style view of the conversation, showing system prompts, user messages, assistant responses, and tool call arguments and results.
No more guessing about LLM usage or digging through raw JSON. With GenAI telemetry, every prompt, response, and tool call is visible at a glance.
Explore metrics
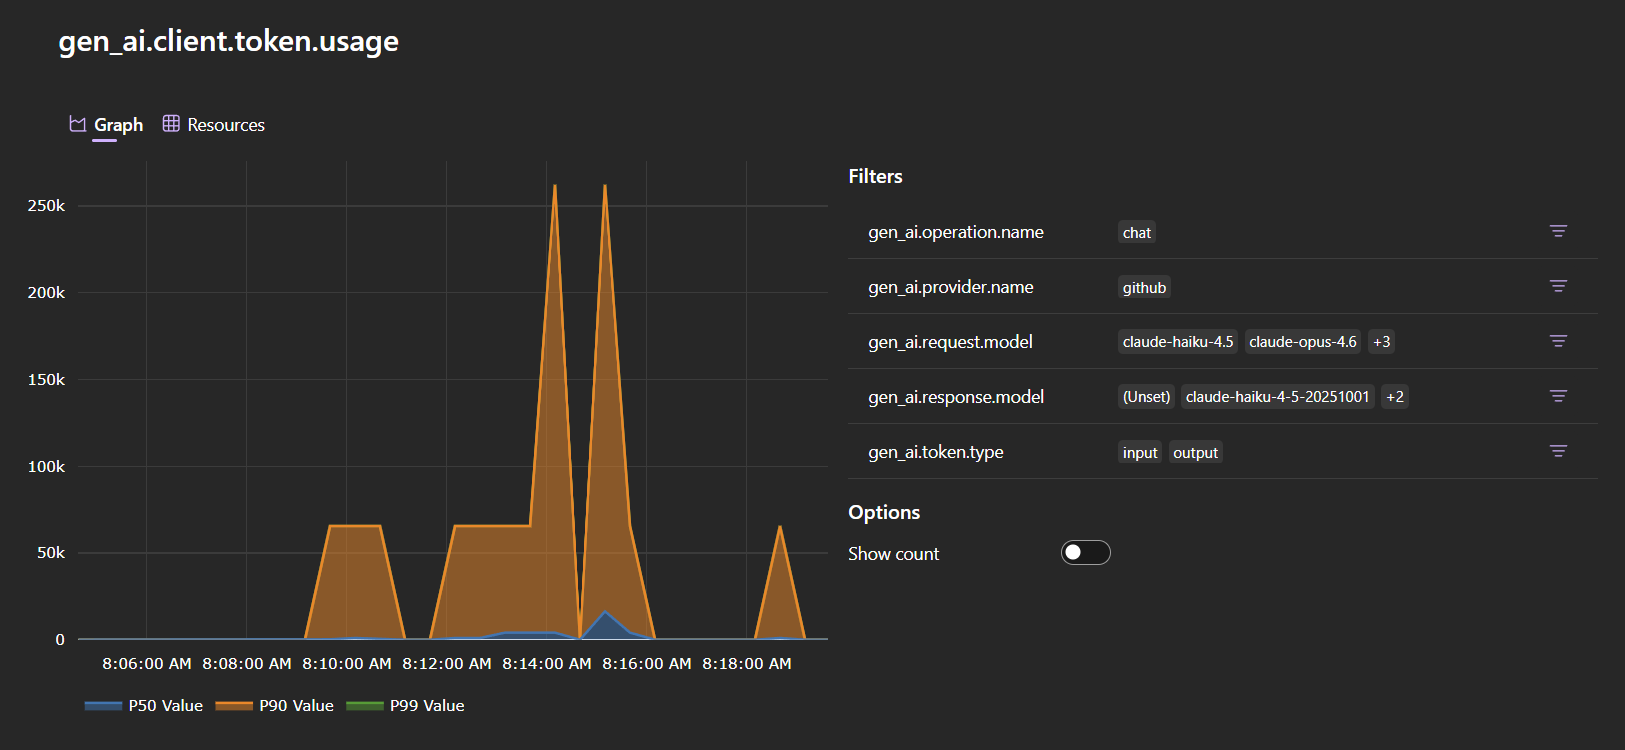
Navigate to the Metrics page and select the copilot-chat service. The
GenAI metrics are prefixed with gen_ai:
gen_ai.client.operation.duration— histogram of LLM call latencies. Filter bygen_ai.request.modelto compare models.gen_ai.client.token.usage— histogram of token consumption. Filter bygen_ai.token.typeto separateinputfromoutputtokens.
These metrics let you estimate per-request cost, catch token-hungry prompts before they hit production, detect latency regressions, and monitor usage patterns across models and agents.
Beyond this demo
The GenAI semantic conventions are already in use today and under active development — your feedback on real-world usage directly shapes what gets standardized next.
- Test GenAI instrumentation in your own applications and report issues.
- Join the GenAI Semantic Conventions and Instrumentation SIG discussions.