Zero-code trace-log correlation with OBI
You get paged. A trace shows a request failing in one of your services, and you know the answer is in the logs — but which log lines belong to that request? If the service never adopted structured logging with trace context, the honest answer is: you grep by timestamp and hope.
OpenTelemetry eBPF Instrumentation (OBI) can now add that missing trace context to the logs your services already write. Your applications don’t change: no SDK, no logging-library configuration, no application rebuild or redeploy.
The boundaries up front: it applies to logs written to stdout or stderr — the streams your container runtime captures — and a line is annotated when OBI has active trace context for the request being served at the moment of the write. What you roll out is an OBI configuration change and a one-line filter in your log pipeline.
Under the hood, OBI already knows — through eBPF — which request each thread is serving at the moment it writes a log line; that’s the entire trick. The correlation fields are added before the container logging pipeline receives the line. The rest of this post covers what changes in practice, what the feature requires from your environment, and how to enable it.
What changes during an incident
Your application writes this:
{ "level": "INFO", "message": "payment authorized", "amount": 42 }
The container log ends up with this:
{
  "level": "INFO",
  "message": "payment authorized",
  "amount": 42,
  "trace_id": "4bf92f3577b34da6a3ce929d0e0e4736",
  "span_id": "00f067aa0ba902b7"
}
The IDs are the same ones OBI reports on the spans for that request, so
correlation works in both directions: paste the trace_id from a failed trace
into your log search and get exactly the log lines for that request, or copy the
trace_id from a suspicious log line into your trace backend and land on the
trace it belongs to.
It works for JSON logs, NDJSON, and plain text — free-form lines get a
key=value annotation:
payment authorized trace_id=4bf92f3577b34da6a3ce929d0e0e4736 span_id=00f067aa0ba902b7
If your logger already emits one of the configured fields, OBI preserves it and only fills in what’s missing.
Here it is end to end, on a small demo: an uninstrumented Go frontend that
calls an uninstrumented Go backend, each logging one JSON line per request,
plus OBI and Jaeger — four containers total. No OpenTelemetry SDK anywhere in
the application code.
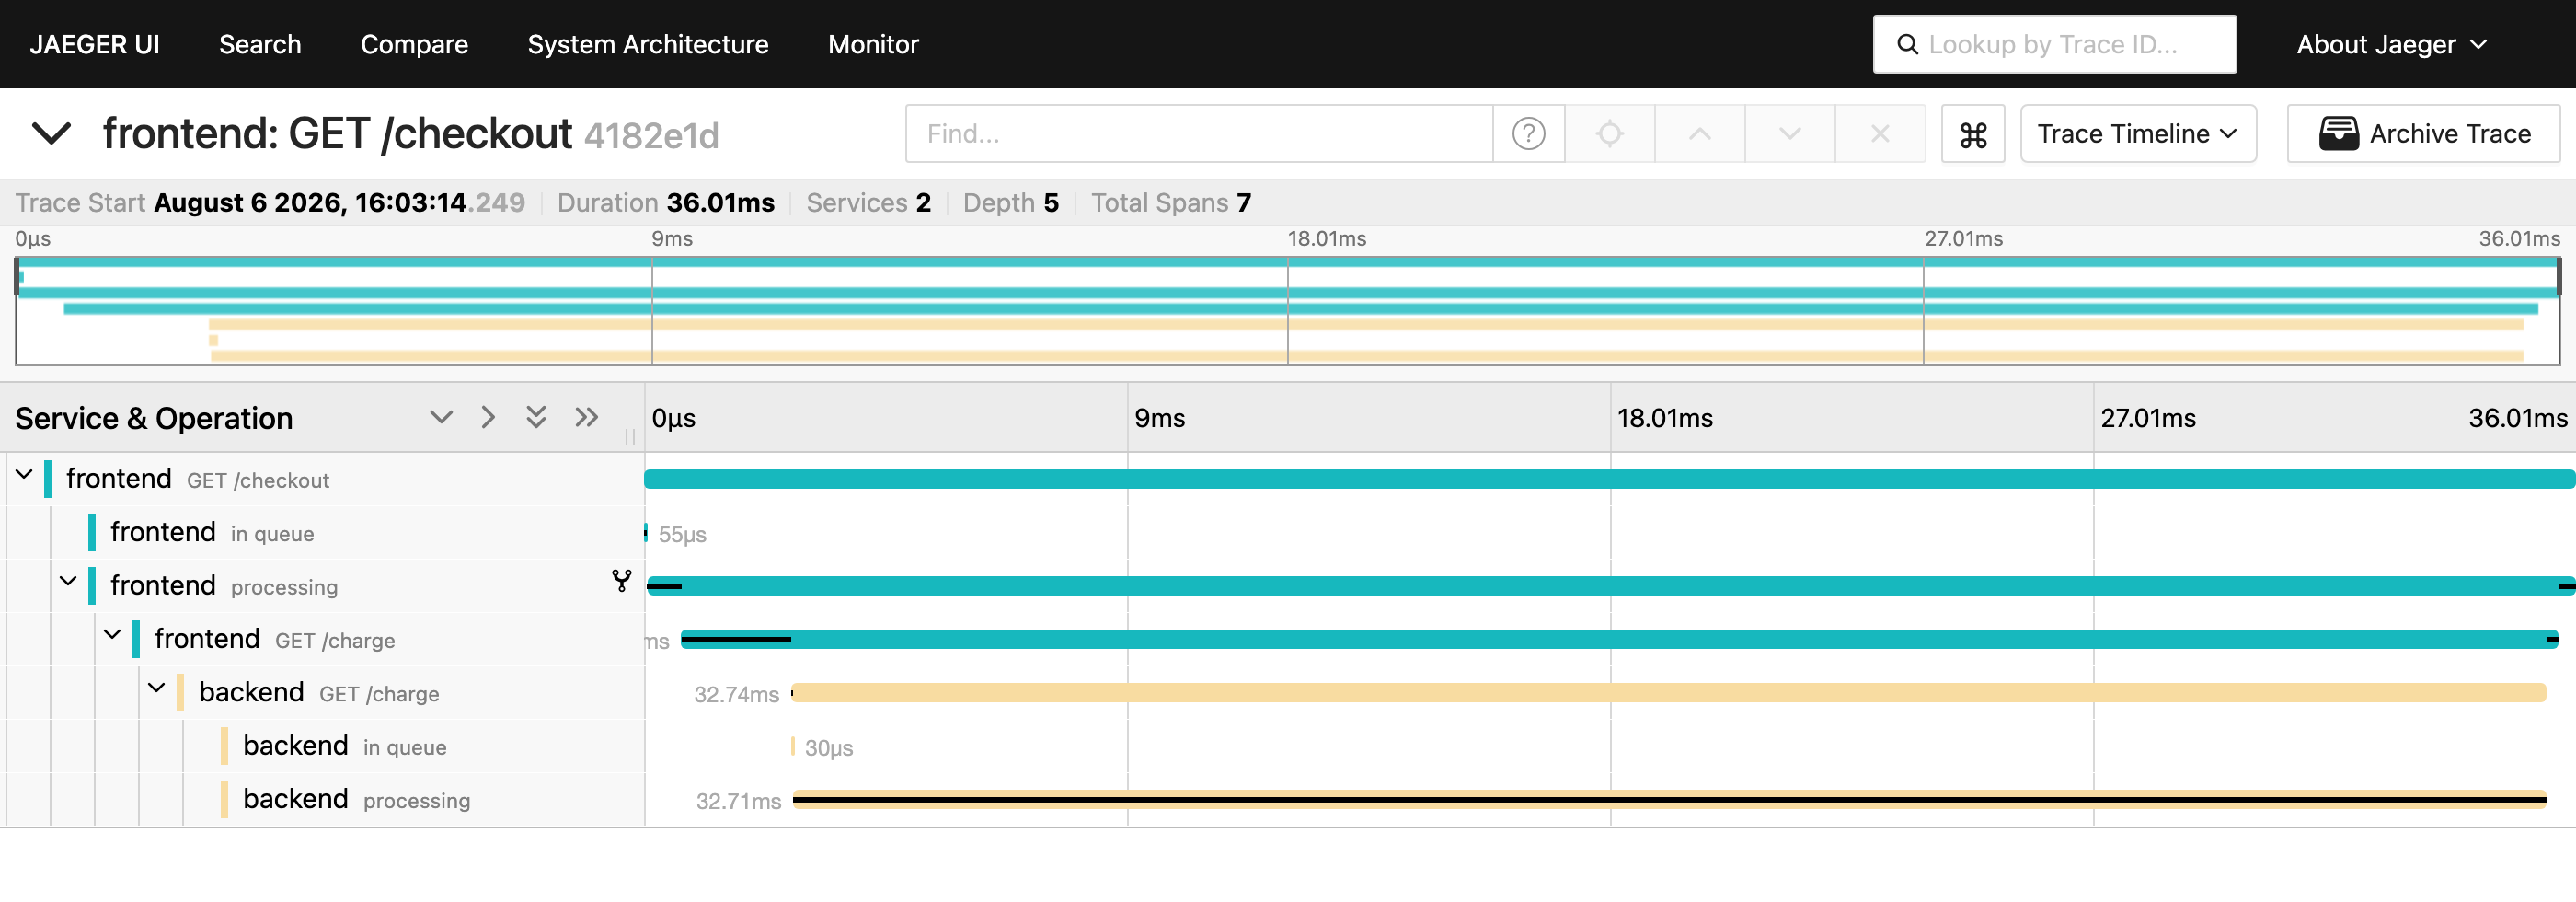
A single request to the frontend produces one distributed trace in Jaeger — OBI also propagates the trace context between the two services, so the frontend and backend spans join under one trace:
Both services logged plain JSON with no trace fields; OBI injected matching
context — the same trace_id in both services, each with its own span_id:
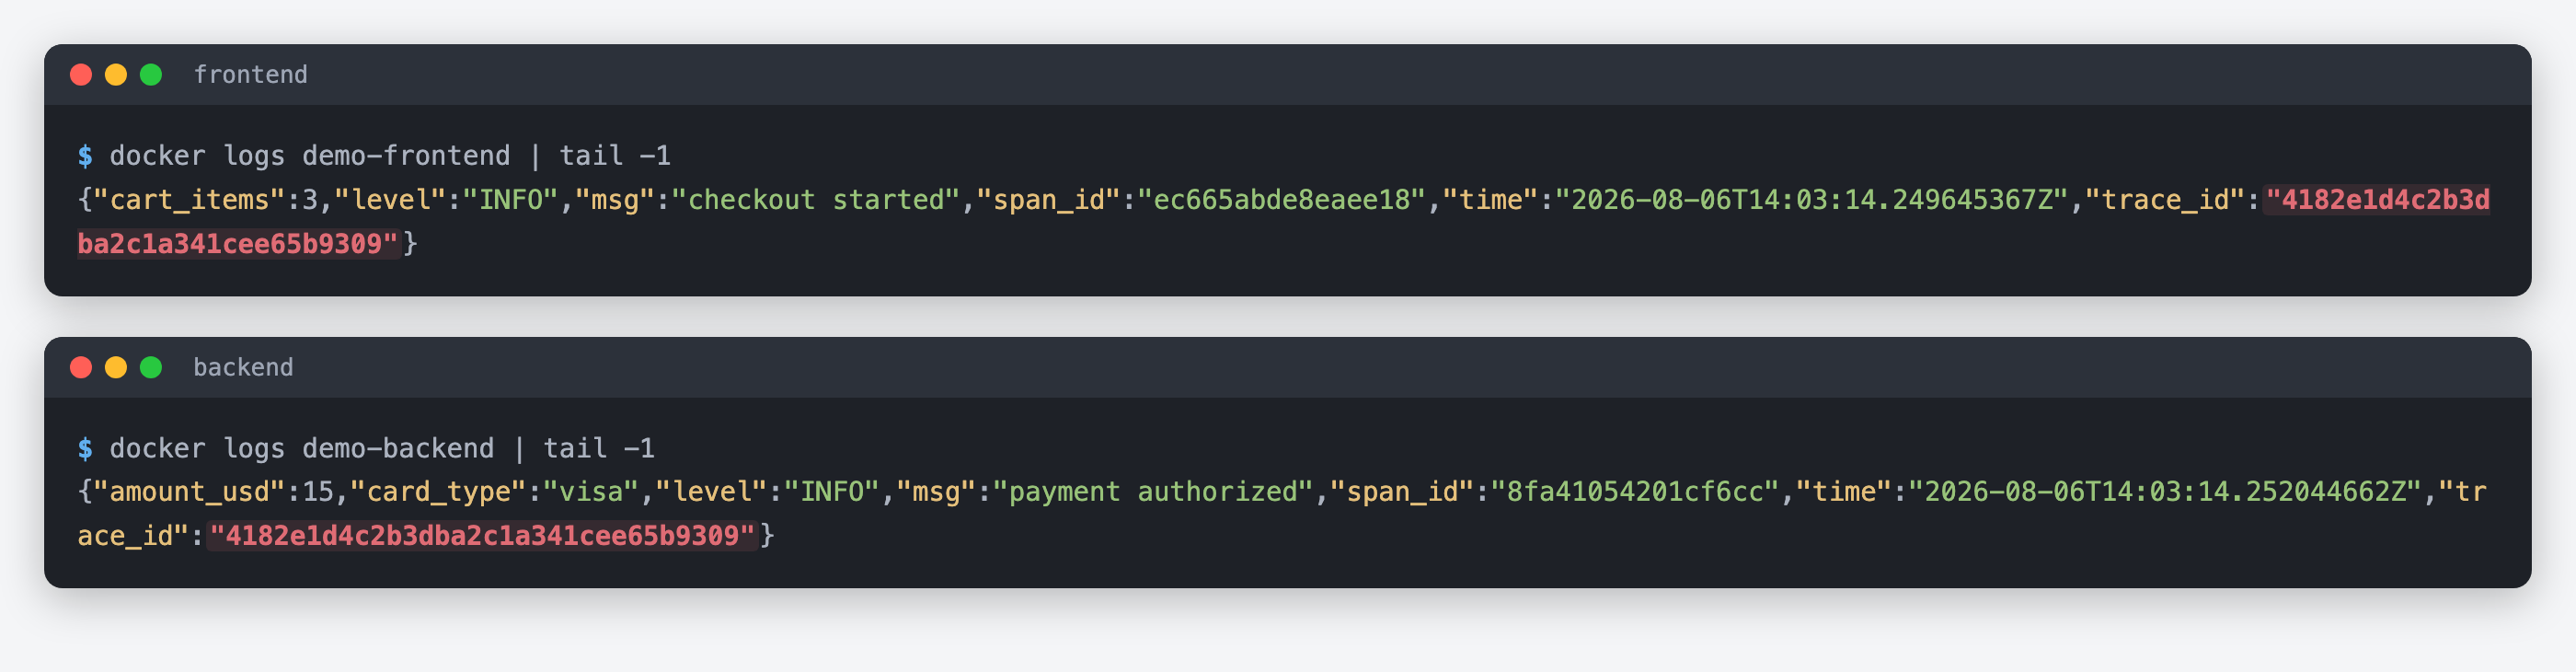
Searching Jaeger for the trace_id from either log line lands on exactly the
trace shown above.
Is this a fit for your environment?
Check these before you plan a rollout:
- Log destination. Enrichment covers logs written to stdout or stderr and captured by the container runtime. Logs written directly to files or shipped over the network by an in-process appender are not covered.
- Active trace context. A line is enriched only when it is written while OBI is tracing a request on that service — an HTTP or gRPC request, a client call, or a database operation in flight. Startup messages and background-job logs pass through unchanged.
- Kernel and privileges. OBI’s log enricher needs
CAP_SYS_ADMINand a kernel that is not in lockdown mode. Enriching the commonwrite()path requires Linux 6.0 or later; on older kernels onlywritev()-based writes are enriched, so coverage depends on how your runtime’s logger writes. - Synchronous logging. The link between a log line and a request relies on
the write happening from the thread serving the request. Go, Java, and Ruby
loggers do this by default. Node.js stdout is asynchronous when backed by a
pipe — the default in containers — so under write backpressure occasional
lines can miss or carry stale context. Python needs
PYTHONUNBUFFERED=1; .NET needs a synchronous console writer. Java virtual threads are not enriched yet; platform-thread workloads are unaffected. - Services instrumented with an OTel SDK. Enrichment works there too, and is
useful when the SDK exports traces but not logs: OBI injects only
trace_id, because the span IDs OBI generates would not match the SDK’s — and a wrong span link is worse than none. You can still find the transaction in the logs by trace ID.
Enable it
The enricher is opt-in. With version 2 configuration, enable it under
extensions.obi.correlation.log_trace_annotation. Its match list takes the
same match clauses as capture rules and selects which captured workloads get
annotated. It must select at least one workload, and a workload outside your
capture selection is never annotated:
extensions:
  obi:
    version: '2.0'
    capture:
      policy:
        default_action: exclude
      rules:
        - action: include
          match:
            process:
              exe_path_glob:
                - /frontend
                - /backend
    correlation:
      log_trace_annotation:
        enabled: true
        match:
          - process:
              exe_path_glob:
                - /frontend
                - /backend
        plain_text:
          enabled: true
          placement: suffix
          multiline: first_line
The plain_text block controls where the key=value annotation is placed on
non-JSON logs and which lines of a multi-line write get it. The injected field
names default to trace_id and span_id and are configurable via
field_names, so the output matches whatever your log pipeline already expects.
With version 1 configuration, the same selection lives under
ebpf.log_enricher.services — see the
trace-log correlation documentation
for the details.
One pipeline change is required: for each enriched line, the original un-enriched line is replaced by a blank placeholder (NUL bytes) in the container log, and the enriched line is appended in its place. Add a filter to your log shipper that drops the blank placeholder lines — a single rule that matches all-NUL records.
Before enabling it in production
Behavior to account for in your rollout plan:
- Large writes are split. A single
write()orwritev()larger than 8 KiB is not enriched intact: the captured prefix is re-emitted with trace context while the remainder reaches the log stream separately, without enrichment — one logical record can become two. If your services routinely emit very large log lines, measure before enabling. - Roll out incrementally. Start with one low-risk service in
matchand check two things in your log backend: the blank placeholder lines are being dropped by your filter, and log lines appear once — not duplicated, not split. Then add more services tomatch. Services left out ofmatchare still traced; only their logs are left unchanged. Rolling back is removing a service frommatch, or settingenabled: falseto turn annotation off for every service; the application is untouched in either direction.
Try it
Trace-log correlation ships in OBI. Point it at one service, add the placeholder filter to your log shipper, and your existing logs — with no application rebuild or redeploy — start carrying the trace IDs you needed during the last incident.
- Run the demo from this post yourself: docker compose example
- OBI documentation
- OBI repository
- Curious how it works under the hood? The eBPF internals live in the developer documentation
- Questions or feedback: the #otel-ebpf-instrumentation channel on the CNCF Slack