Prometheus and OpenTelemetry interoperability in 2026: Survey results
We ran a survey asking users of OpenTelemetry and Prometheus how they collect, process, and store metrics. The goal was to understand, with real usage data rather than assumptions, how far the ecosystem has moved and whether the interoperability still causes friction.
Key takeaways
- Interoperability has measurably improved since our 2024 survey: the average ease-of-use rating rose from 3.1 to 3.6, the equivalent of one in two respondents rating a whole category higher, and the share of respondents finding the two hard to use together fell from 29% to 10%.
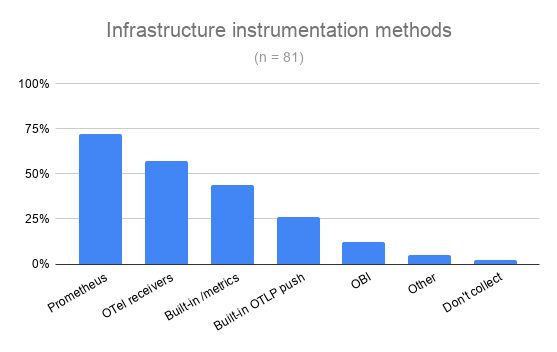
- In infrastructure instrumentation, Prometheus exporters remain the most-used method (72%) with OTel receivers close behind (57%), and nearly half of respondents run both at once rather than migrating from one to the other.
- In application instrumentation, OTel SDKs are the most-used method at 65% with Prometheus SDKs at 52%, and 41% use only the OTel style of application instrumentation.
- Prometheus relabeling rules (54%) and the open source OTel Collector (53%) are the two most common processing steps, and 65% of respondents run a “vanilla stack” of one or both with no vendor transformation or custom Collector build anywhere in the pipeline.
Demographics
From 186 people who responded, 81 passed our screening for active OpenTelemetry-for-metrics users on a Prometheus-adjacent backend. We also filtered out observability vendor employees to focus on end users. In the analyzed sample:
- All respondents are active OpenTelemetry users.
- All respondents use some flavor of Prometheus – Prometheus itself (46%), an open source Prometheus-compatible backend such as Thanos, Cortex, or Grafana Mimir (42%), or a PromQL-compatible vendor product (12%).
- Respondents’ observability maturity is high. 48% describe their organization as having “a well-established observability practice” (Expert), 41% are “setting up an observability practice” (Intermediate), while only 11% consider themselves beginners in observability.
- Organizations skew large. 42% have 1,000+ employees, 31% have 100–999, 15% have 50–99, and 12% report having under 50.
Ease of use change over time
How easy or difficult is it to use OpenTelemetry and Prometheus together?
This year, we asked the same question as in the similar 2024 survey to see whether end users saw progress in interoperability.
The average rating rose by 0.5 point, from 3.1 to 3.6 — as if every second respondent had moved up a full category. The clearest movement is at the difficult end of the scale: the share of respondents who found the two hard to use together dropped to roughly a third of its 2024 level. Also, nobody this year picked “Very difficult”.
Two years of work on interoperability is paying off. At the same time, since the single largest group of responses sits at “Neither easy nor difficult”, there is still a lot of work to be done in this area.
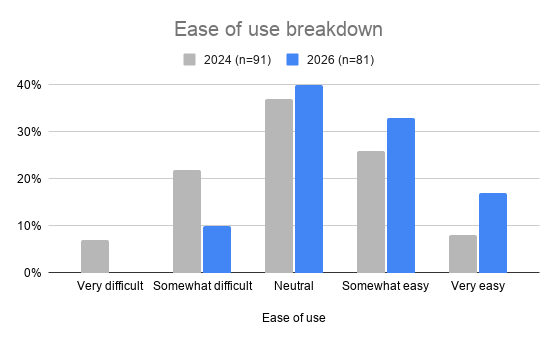
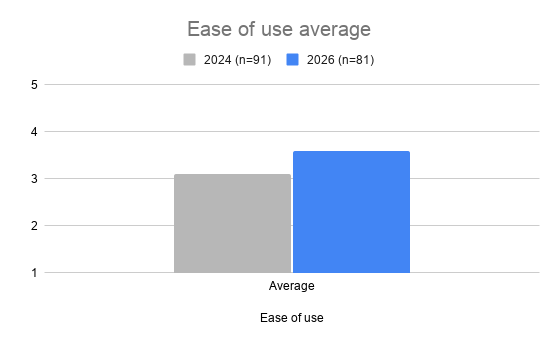
Note: The 2024 survey didn’t ask respondents whether they worked for an observability vendor, so this is not an exact apples-to-apples population match. However, putting vendor employees back into the 2026 sample (n = 108) would barely change the result for the ease of use rating (0%, 10%, 40%, 33%, 17% → 0%, 10%, 41%, 33%, 16%). To keep this year’s results consistent, we decided to stick with filtering vendor employees out.
Infrastructure metrics
How do you instrument infrastructure metrics collection?
Prometheus exporters are the most common single instrumentation method for
infrastructure metrics but OTel receivers are close behind. Built-in /metrics
endpoint, built-in OTLP push, and OpenTelemetry eBPF instrumentation (OBI)
follow.
When looking at how these methods combine, the picture is clearly hybrid, not either/or. Nearly half of respondents are mixing Prometheus and OTel instrumentation styles at once for infrastructure metrics, rather than doing a full migration. Among respondents using a single instrumentation style, Prometheus-only style is twice as popular as OTel-only style.
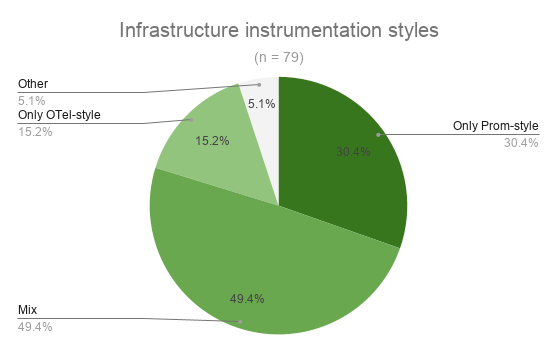
Note: Instrumentation style describes whether a respondent uses methods
native to one project only, or a mix of both. OTel-style includes using OTel
receivers, Built-in OTLP push, or OpenTelemetry eBPF Instrumentation (OBI).
Prometheus-style includes Prometheus exporters or Built-in /metrics endpoint
(no exporter). The 4 “Other” responses are write-ins: Zabbix, Heorku Telemetry
(likely “Heroku Telemetry”), textfile collector, Telegraf. All 4 respondents
also selected a real Prometheus/OTel method alongside their write-in — but in
the style chart above, a write-in places a respondent in “Other” regardless of
what else they selected.
Work in progress: The Prometheus and OTel communities are working on making Prometheus exporters run as an OTel Collector distribution. The conversations are still ongoing. The discussion is open in this issue.
Application metrics
How do you instrument application metrics collection?
Preferences swap for application instrumentation. OTel SDKs come out on top with Prometheus SDKs following behind them. OBI holds roughly the same share as in infrastructure instrumentation.
Instrumentation styles shift as well. The largest share of participants (41%) use only OTel style instrumentation, nearly twice as common as only Prometheus style. Fewer than a third mix styles.
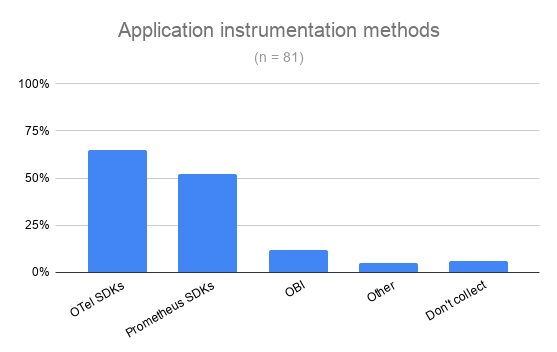
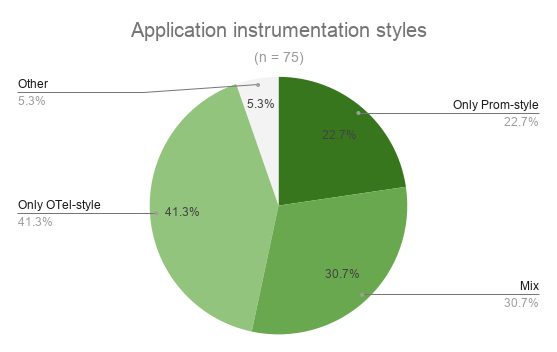
Note: In application instrumentation, OTel-style includes using OTel SDKs or OpenTelemetry eBPF Instrumentation (OBI). Prometheus-style includes Prometheus SDKs. Again, there are 4 write-ins that we categorized as “Other”: already built exporters, Micrometer, textfile collector, jvm-exporter. 3 of the 4 also selected a real Prometheus/OTel method. One respondent’s original write-ins, “Self instrumentation” and “manual instrumentation for OTEl,” were recoded to plain OTel SDKs.
Transformation
What do you use to process or transform metrics before sending them to storage?
Prometheus relabeling rules and the open source OTel Collector are the two most common processing steps with neither of them leading clearly.
Most respondents run a vanilla stack: only Prometheus relabeling rules and/or the plain OTel Collector, with no vendor distribution and no custom-built Collector in the pipeline. The three vanilla patterns come out close to even.
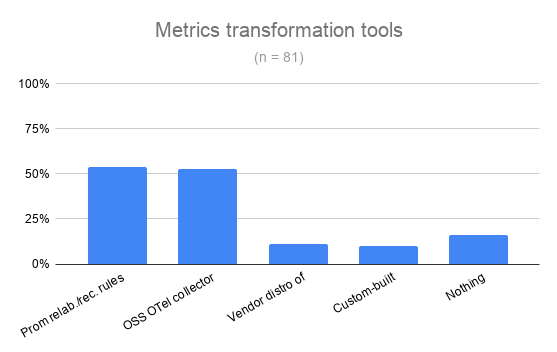
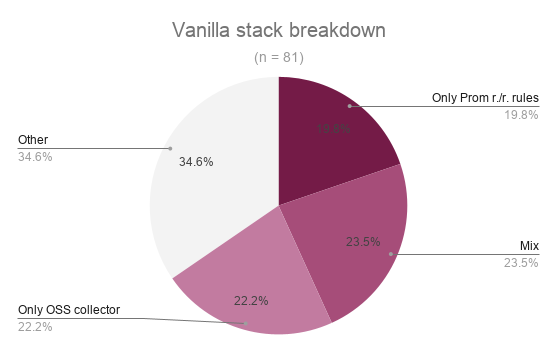
Note: “Other” combines respondents who do no transformation at all (15%, n=12) with those using a vendor distribution or custom-built Collector (20%, n=16).
What practitioners want improved
What would you like us to improve to make OpenTelemetry and Prometheus work better together?
We received 19 open-ended responses with suggestions on what to improve. Three themes emerged from this data: unification of Prometheus and OTel’s data models (attributes/labels), better handling of resource attributes and metadata, and naming and formatting friction. There were also a few individual asks. Prometheus maintainers György “Krajo” Krajcsovits and Arthur Sens went through the responses and addressed each point below:
- Unifying Prometheus and OTel’s data models (attributes/labels)
- This is a valid ask that we recognize. We will raise it for a discussion at the Prometheus Dev summit in October.
- Resource attributes and metadata gaps
- This should be addressed by the native metadata design doc. One thing that we have to wait for is finishing the OTel Entities spec.
- Naming and formatting friction
- Several relevant things already exist — the OpenMetrics 2.0 exposition format lets OTel-style names be used directly in code, PromQL already supports UTF-8 metric names, and Prometheus’s OTLP receiver has configurable translation strategies. The pieces exist; they’re just not the default yet. We have to work on this.
- Using Prometheus native recording rules in the Collector
- There’s an open Prometheus proposal and proof-of-concept PR for scrape-time recording rules, which wouldn’t need a full TSDB the way recording rules do today. Since the OpenTelemetry Collector’s Prometheus Receiver uses Prometheus code as a Go Library, this proposal would also benefit the Collector.
- Enable MCP or agentic AI workflows
- Prometheus just onboarded the Prometheus MCP project repository to its GitHub org. This should enable MCP workflows for Prometheus. The Prometheus community would love to see people start using it and get feedback. Also, the native metadata design doc explains how we plan to make agentic AI workflows even better in Prometheus.
Interesting observations
Mid-size organizations may be furthest into OTel-native tooling
In our data, organizations with 100–999 employees have the highest OTel SDK adoption for application metrics and OTel receiver adoption for infrastructure metrics. eBPF-based instrumentation (OBI) doesn’t follow the same pattern — there, it’s the 1,000+ organizations that stand apart from every smaller band.
Adoption by organization size:
| Organization size | OTel SDKs (application) | OTel receivers (infrastructure) | eBPF / OBI (infrastructure) |
|---|---|---|---|
| 1–49 (n = 10) | 40% | 20% | 20% |
| 50–99 (n = 12) | 58% | 58% | 17% |
| 100–999 (n = 25) | 84% | 76% | 20% |
| 1,000+ (n = 34) | 62% | 53% | 3% |
Our hypothesis is that mid-size organizations — big enough to have a dedicated platform effort, small enough to move without a multi-year migration plan — might be pushing furthest into newer OTel-native tooling.
Note: This is an interesting observation and a hypothesis, not a confirmed finding: with 10–34 respondents per band, none of these gaps is big enough for a survey this size to confirm.
Team type tracks backend choice
Platform Engineering and SRE teams lean heavily toward OSS Prometheus-compatible backends (Thanos, Cortex, Mimir), while Dev teams lean the other way, toward plain Prometheus.
Here, the dividing line looks like operational ownership rather than preference. Teams running metrics for a whole organization eventually outgrow a single Prometheus deployment, whereas teams instrumenting their own service generally don’t.
Backend choice by team type — OSS Prometheus-compatible (n = 30), Prometheus (n = 35), PromQL-compatible vendor (n = 8):
| Team type | OSS Prometheus-compatible | Prometheus | PromQL-compatible vendor |
|---|---|---|---|
| Dev | 24% | 71% | 6% |
| DevOps | 23% | 62% | 15% |
| Observability | 29% | 41% | 29% |
| Platform Engineering | 69% | 31% | 0% |
| SRE | 69% | 31% | 0% |
Note: Sysadmin (n = 6) and Operations (n = 2) respondents are excluded from this table — both groups are too small to interpret — leaving n = 73 of the 81 respondents. As with the previous breakdown, the per-band numbers here (8 to 35) are too small to draw firm conclusions.
Get involved
Interoperability is measurably easier than it was two years ago, but the open-ended answers point to concrete gaps — data model differences, resource attributes and metadata gaps, and naming and formatting friction. There is still a lot of work to do on both the OpenTelemetry and the Prometheus side.
Everyone is welcome to contribute. The discussion happens in the #otel-prometheus channel in the CNCF Slack.