OpenTelemetry Profiles Enters Public Alpha
Since OpenTelemetry first introduced Profiles, momentum has only grown towards building a unified industry standard for continuous production profiling, standing alongside traces, metrics, and logs. Today, the Profiling SIG is proud to announce that the Profiles signal has officially entered public Alpha, and we are ready for broader community use and feedback.
Production profiling for all
Continuously capturing low-overhead performance profiles in production is a technique that has been used for decades. It helps troubleshoot production incidents, improves user experience by making software faster and reduces computation costs by making the same work take less resources. Historically, the industry lacked a common framework and protocol for continuous profiling, even with formats like JFR and pprof being popular.
With OpenTelemetry Profiles, we’re introducing an industry-wide standard for production profiling, with true vendor neutrality and powered by community and ecosystem support. There are a few components to making this a reality:
- Creating a unified data representation for profiling data, compatible with existing formats like pprof.
- Introducing a novel reference eBPF-based profiler implementation.
- Making Profiles an organic part of the OpenTelemetry ecosystem, such as integrating it with the OTel Collector.
All of the above have been substantially improved in the Alpha release, so let’s dive into what we’ve been working on!
Standardizing the data representation
Creating a unified profiling format is a significant challenge, as it must serve as the industry standard across diverse environments. The working group had to reconcile numerous requirements: sampling vs. tracing, native vs. interpreted runtimes, the tension between wire/memory-size efficiency and data readability, and other similar aspects.
The resulting Profiles Alpha format offers a balanced feature set that can efficiently capture profiling data:
- The stack representation is deduplicated so that each unique callstack is stored only once, allowing efficient encoding of diverse profiling data.
- The dictionary tables for other common entities also allow efficient data normalization.
- While primarily focused on encoding aggregated data, the format also allows capturing timestamped event data to support use cases such as recording individual (even if sampled) off-CPU events.
- Resource attributes allow augmenting the data model with additional information. String dictionary support enables efficient (40% smaller wire size) linking of profiling data to the same resource that emitted associated logs, metrics or traces.
- Profile samples can be further associated with the Tracing
trace_id/span_idattributes, enabling cross-signal correlation of the data. - Semantic conventions provide definition for the most common profiling-specific attributes.
Originally inspired by the pprof format and developed in collaboration with
pprof maintainers, OTLP Profiles has evolved into an independent standard that
addresses the broad requirements of the OpenTelemetry ecosystem. Data in the
original pprof format can be round-trip converted to/from OTLP Profiles with no
loss of information. For that purpose a new native
translator
is now included to ensure seamless interoperability.
To ensure data quality and ease of adoption, we are also releasing a conformance checker tool. This allows validating that the exported profiles adhere to the technical specifications and semantic conventions of OpenTelemetry Profiles.
Frictionless insights with the eBPF Profiling Agent
With the Elastic donation of its eBPF profiling agent to OpenTelemetry and its integration with the OTel Collector, low-overhead whole-system continuous profiling on Linux with support of the most widely-used language runtimes without any additional instrumentation is available to every OpenTelemetry user.
A number of significant improvements are available with the Alpha release:
- The eBPF agent now works as an OpenTelemetry Collector receiver, leveraging existing OpenTelemetry processing pipelines for metrics and K8s metadata, and is shipped as an official collector distribution.
- Automatic on-target symbolization of Go executables
- ARM64 support for Node.js V8
- Initial support for BEAM (Erlang/Elixir)
- Support for .NET 9 and 10
- Fixes and improvements to Ruby unwinding and symbolization
Profiles in the OTel ecosystem
OpenTelemetry is a holistic ecosystem with many orchestrated parts. It’s critical that a new signal like Profiles integrates ubiquitously, so that all signals can benefit from each other. The Alpha release brings multiple improvements in this area across many dimensions of the OTel universe.
Some notable examples of the horizontal integration of Profiles include:
- OTel Collector now includes support for receiving Profiles data in specific
formats or augmenting profiles with infrastructure information.
- A pprof receiver allows receiving profiles from pprof-formatted files.
- The k8sattributesprocessor allows augmenting profiles with Kubernetes metadata.
- OTTL support allows building custom rules to transform, or filter profiles.
- OTLP Resource model was updated to allow efficient information sharing, including updating Collector to transparently support this optimization for Profiles signal.
Getting started
To learn more about OpenTelemetry profiles, you can visit the profiles concepts page that is part of the OpenTelemetry documentation.
The easiest way to get started with an actual deployment is to use the OpenTelemetry eBPF profiler in combination with a backend that supports OTLP Profiles. As the signal is still under development, production-ready backends have not yet emerged but multiple vendors are working on supporting OpenTelemetry Profiles.
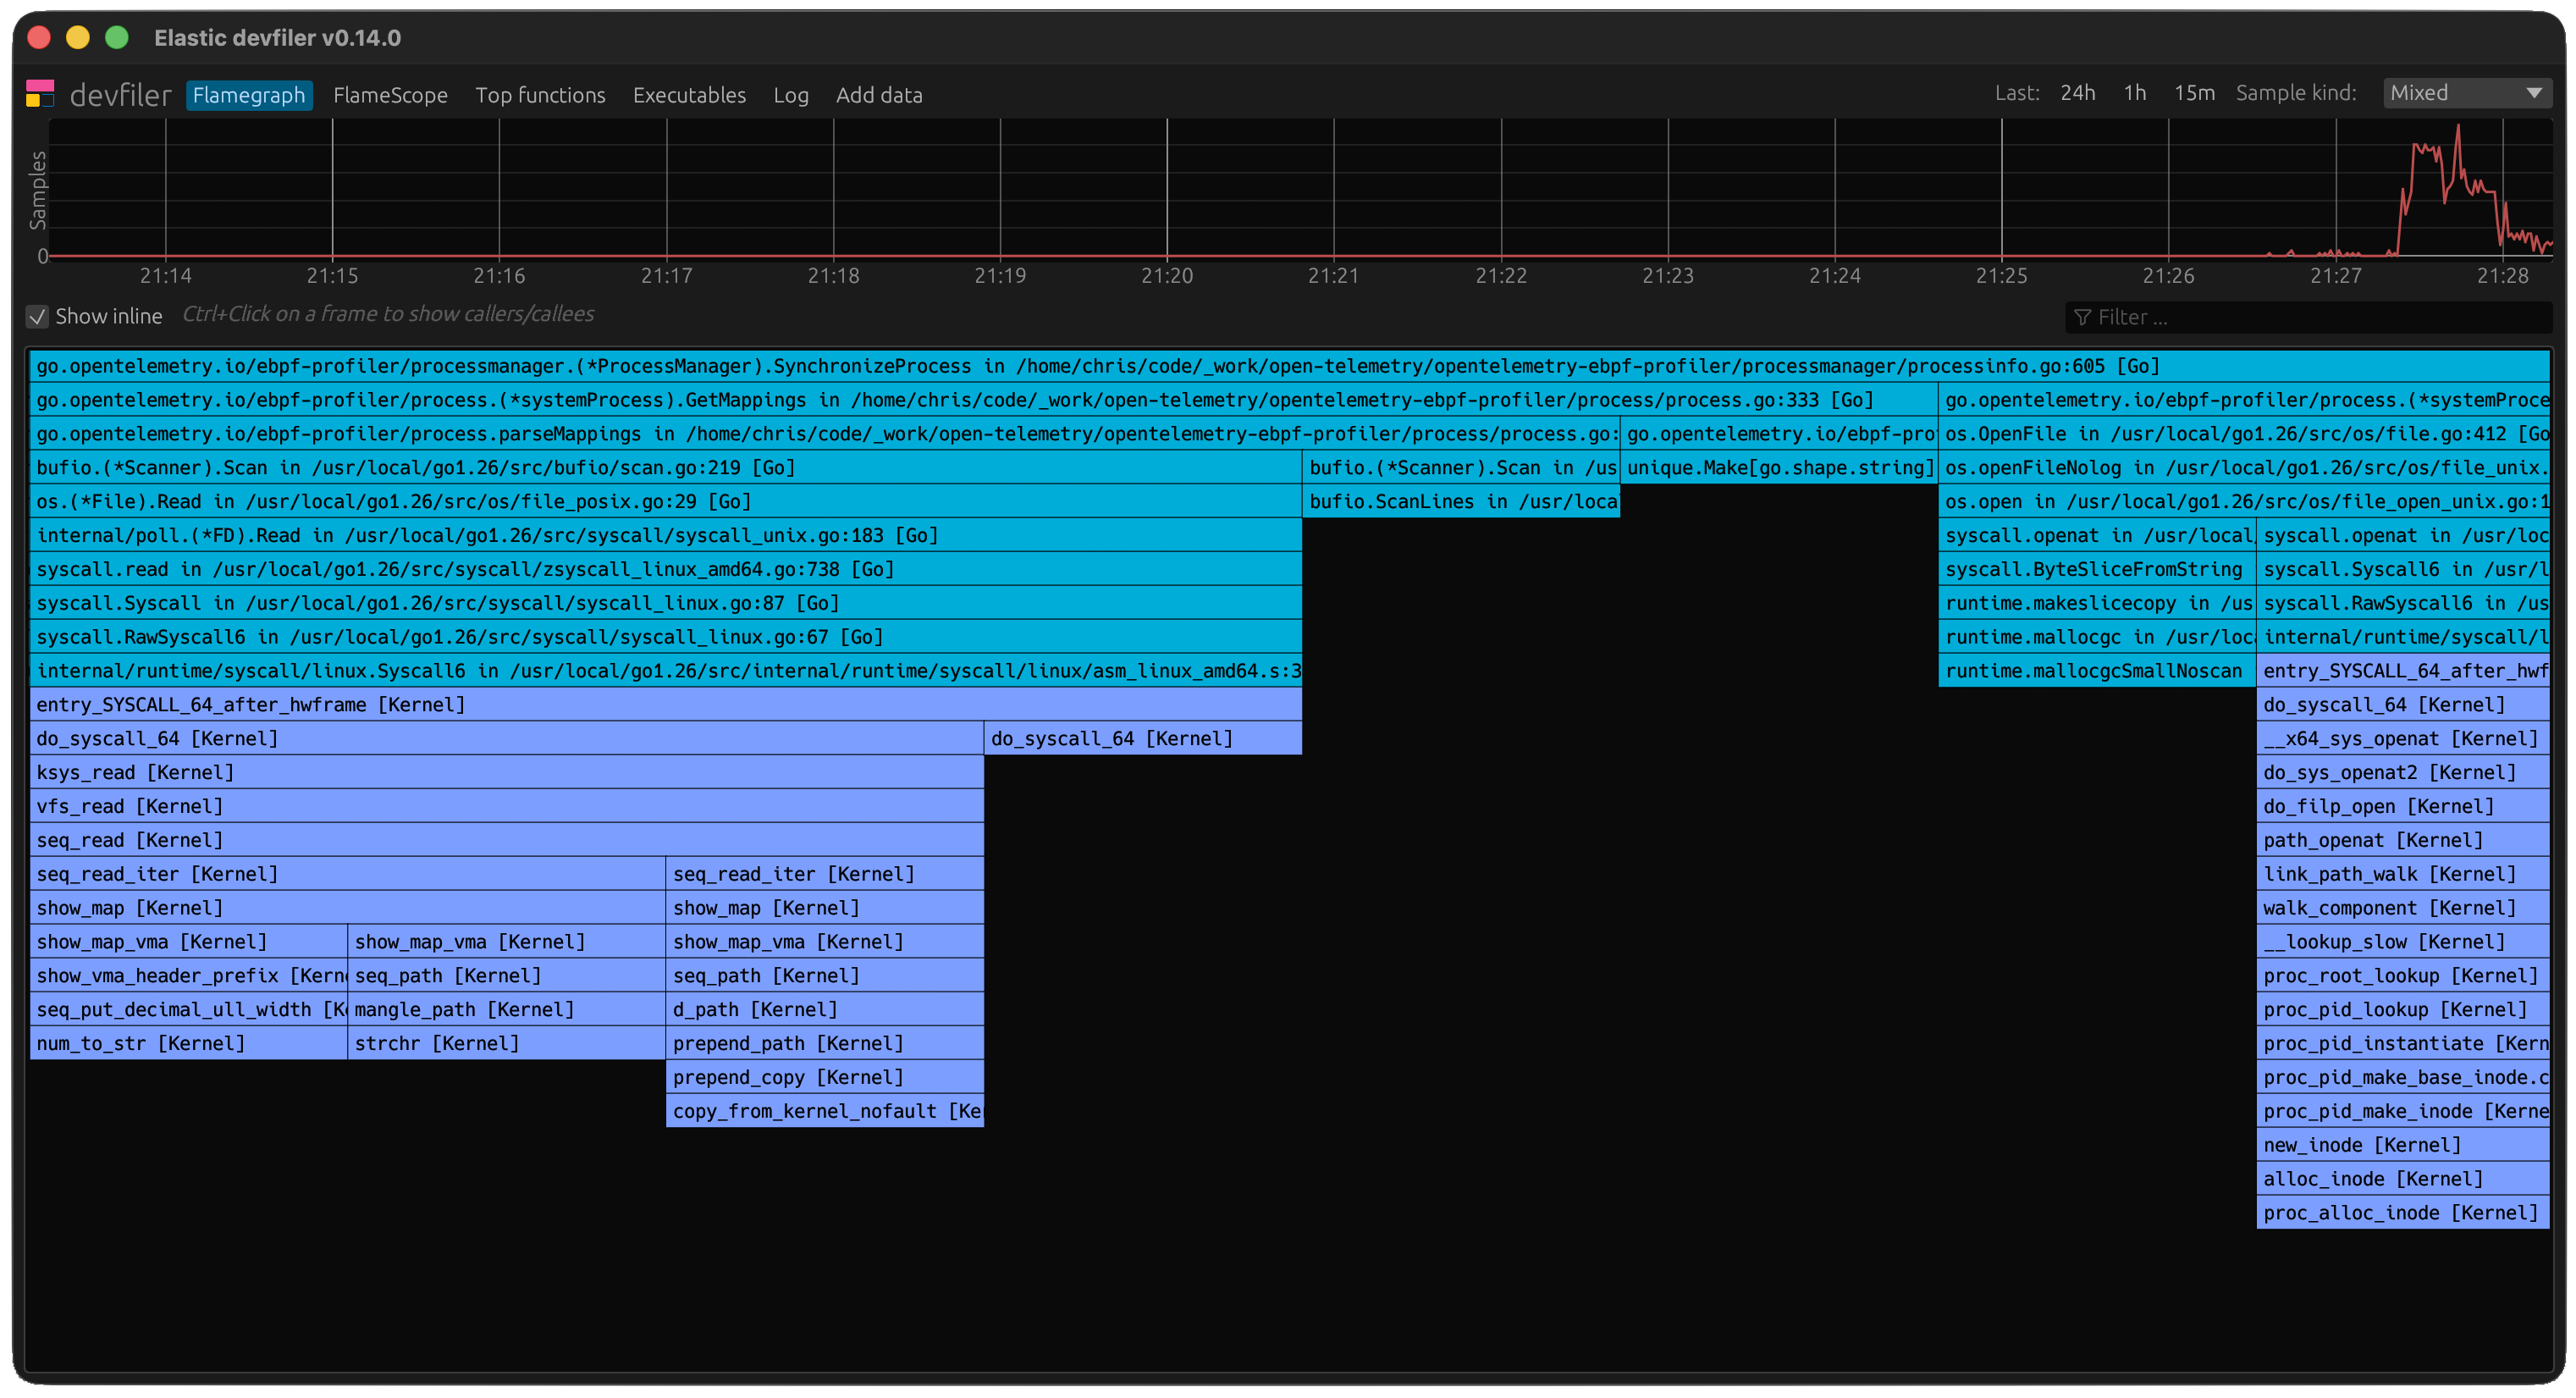
To speed up development and experimentation, Elastic has open-sourced a desktop application named devfiler that reimplements the backend (collection, data storage, symbolization and UI) portion of the eBPF profiler. Note that devfiler is not a real production backend and should not be used as such. For further instructions, please refer to the eBPF profiler repository.
Brought to you by…
Projects like this involve many people. Thanks to everyone who made this possible, including:
- Alexey Alexandrov (Google)
- Ivo Anjo (Datadog)
- Frederic Branczyk (Polar Signals)
- Roger Coll (Elastic)
- Dmitry Filimonov (Grafana Labs)
- Felix Geisendörfer (Datadog)
- Nayef Ghattas (Datadog)
- Jonathan Halliday (Red Hat)
- Dale Hamel (Shopify)
- Joel Höner (Zymtrace)
- Christos Kalkanis (Elastic)
- Florian Lehner (Elastic)
- Damien Mathieu (Elastic)
- Greg Mefford (Adobe)
- Tigran Najaryan (Splunk)
- Tommy Reilly (Polar Signals)
- Tim Rühsen (Zymtrace)
- Josh Suereth (Google)
- Timo Teräs (Elastic)
- Brennan Vincent (Polar Signals)
What’s next
We encourage teams building profiling tools and products to start using the OpenTelemetry Profiles. Here is how you can participate:
- Add OTel Profiles as an export or receive option in your tool. This is already happening (e.g. async-profiler)!
- Test the eBPF agent and OTel Collector (v0.148.0 or newer) support for Profiles and report issues. Or even send PRs!
- Review the signal documentation and suggest what can be improved.
Note that with the Alpha status of the release, the signal should not be used for critical production workloads. See the definition of the Alpha maturity level in OpenTelemetry for details.
In the meantime and towards the next milestone, there is a lot of exciting work planned and in the works:
- As correlation of signals is crucial for the success of observability, there is ongoing work on sharing information between eBPF based agents, like OBI and Profiling Agent.
- Symbolization is a key component of every production profiling stack, so we are discussing standardizing the API, the storage format and publishing a reference implementation for it.
- Sharing of runtime information between in-process SDK code and eBPF agents is important for cross-signal correlation to allow answering questions like “What were the off-CPU events for traces at the 99% latency?”. Process context and thread context sharing OTEPs are in the works to enable this.
And for all of this, we need your feedback! To reach us, file a GitHub issue in the OTLP or Profiling SIG repository. It will help make the signal fit the industry needs and steadily evolve it towards its next heights: Beta and GA releases!