Management
This document describes how you can manage your OpenTelemetry Collector deployment at scale.
To get the most out of this page you should know how to install and configure the collector. These topics are covered elsewhere:
- Quick Start to understand how to install the OpenTelemetry Collector.
- Configuration for how to configure the OpenTelemetry Collector, setting up telemetry pipelines.
Basics
Telemetry collection at scale requires a structured approach to manage agents. Typical agent management tasks include:
- Querying the agent information and configuration. The agent information can include its version, operating system related information, or capabilities. The configuration of the agent refers to its telemetry collection setup, for example, the OpenTelemetry Collector configuration.
- Upgrading/downgrading agents and management of agent-specific packages, including the base agent functionality and plugins.
- Applying new configurations to agents. This might be required because of changes in the environment or due to policy changes.
- Health and performance monitoring of the agents, typically CPU and memory usage and also agent-specific metrics, for example, the rate of processing or backpressure-related information.
- Connection management between a control plane and the agent such as handling of TLS certificates (revocation and rotation).
Not every use case requires support for all of the above agent management tasks. In the context of OpenTelemetry task 4. Health and performance monitoring is ideally done using OpenTelemetry.
OpAMP
Observability vendors and cloud providers offer proprietary solutions for agent management. In the open source observability space, there is an emerging standard that you can use for agent management: Open Agent Management Protocol (OpAMP).
The OpAMP specification defines how to manage a fleet of telemetry data agents. These agents can be OpenTelemetry Collectors, Fluent Bit or other agents in any arbitrary combination.
The term “agent” is used here as a catch-all term for OpenTelemetry components that respond to OpAMP, this could be the collector but also SDK components.
OpAMP is a client/server protocol that supports communication over HTTP and over WebSockets:
- The OpAMP server is part of the control plane and acts as the orchestrator, managing a fleet of telemetry agents.
- The OpAMP client is part of the data plane. The client side of OpAMP can be implemented in-process, for example, as the case in OpAMP support in the OpenTelemetry Collector. The client side of OpAMP could alternatively be implemented out-of-process. For this latter option, you can use a supervisor that takes care of the OpAMP specific communication with the OpAMP server and at the same time controls the telemetry agent, for example to apply a configuration or to upgrade it. Note that the supervisor/telemetry communication is not part of OpAMP.
Let’s have a look at a concrete setup:

- The OpenTelemetry Collector, configured with pipeline(s) to:
- (A) receive signals from downstream sources
- (B) export signals to upstream destinations, potentially including
telemetry about the collector itself (represented by the OpAMP
own_xxxconnection settings).
- The bi-directional OpAMP control flow between the control plane implementing the server-side OpAMP part and the collector (or a supervisor controlling the collector) implementing OpAMP client-side.
Try it out
You can try out a simple OpAMP setup yourself by using the OpAMP protocol implementation in Go. For the following walkthrough you will need Go 1.22+.
We will set up a simple OpAMP control plane consisting of an example OpAMP server and let an OpenTelemetry Collector connect to it using the OpAMP Supervisor.
Step 1 - Start the OpAMP server
Clone the open-telemetry/opamp-go repository:
git clone https://github.com/open-telemetry/opamp-go.git
In the ./opamp-go/internal/examples/server directory, launch the OpAMP server:
$ go run .
2025/04/20 15:10:35.307207 [MAIN] OpAMP Server starting...
2025/04/20 15:10:35.308201 [MAIN] OpAMP Server running...
Step 2 - Install the OpenTelemetry Collector
We need an OpenTelemetry Collector binary that the OpAMP Supervisor can manage.
For that, install the OpenTelemetry Collector Contrib distro.
The path where you installed the Collector binary is referred to as
$OTEL_COLLECTOR_BINARY in the following configuration.
Step 3 - Install the OpAMP Supervisor
The opampsupervisor binary is available as a downloadable asset from
OpenTelemetry Collector releases with cmd/opampsupervisor tags. You
will find a list of assets named based on OS and chipset, so download the one
that fits your configuration:
curl --proto '=https' --tlsv1.2 -fL -o opampsupervisor \
"https://github.com/open-telemetry/opentelemetry-collector-releases/releases/download/cmd%2Fopampsupervisor%2Fv0.157.0/opampsupervisor_0.157.0_linux_amd64"
chmod +x opampsupervisor
curl --proto '=https' --tlsv1.2 -fL -o opampsupervisor \
"https://github.com/open-telemetry/opentelemetry-collector-releases/releases/download/cmd%2Fopampsupervisor%2Fv0.157.0/opampsupervisor_0.157.0_linux_arm64"
chmod +x opampsupervisor
curl --proto '=https' --tlsv1.2 -fL -o opampsupervisor \
"https://github.com/open-telemetry/opentelemetry-collector-releases/releases/download/cmd%2Fopampsupervisor%2Fv0.157.0/opampsupervisor_0.157.0_linux_ppc64le"
chmod +x opampsupervisor
curl --proto '=https' --tlsv1.2 -fL -o opampsupervisor \
"https://github.com/open-telemetry/opentelemetry-collector-releases/releases/download/cmd%2Fopampsupervisor%2Fv0.157.0/opampsupervisor_0.157.0_darwin_amd64"
chmod +x opampsupervisor
curl --proto '=https' --tlsv1.2 -fL -o opampsupervisor \
"https://github.com/open-telemetry/opentelemetry-collector-releases/releases/download/cmd%2Fopampsupervisor%2Fv0.157.0/opampsupervisor_0.157.0_darwin_arm64"
chmod +x opampsupervisor
Invoke-WebRequest -Uri "https://github.com/open-telemetry/opentelemetry-collector-releases/releases/download/cmd%2Fopampsupervisor%2Fv0.157.0/opampsupervisor_0.157.0_windows_amd64.exe" -OutFile "opampsupervisor.exe"
Unblock-File -Path "opampsupervisor.exe"
Step 4 - Create an OpAMP Supervisor configuration file
Create a file named supervisor.yaml with the following content:
server:
  endpoint: wss://127.0.0.1:4320/v1/opamp
  tls:
    insecure_skip_verify: true

capabilities:
  accepts_remote_config: true
  reports_effective_config: true
  reports_own_metrics: false
  reports_own_logs: true
  reports_own_traces: false
  reports_health: true
  reports_remote_config: true

agent:
  executable: $OTEL_COLLECTOR_BINARY

storage:
  directory: ./storage
Make sure to replace $OTEL_COLLECTOR_BINARY with the actual file path. For
example, in Linux or macOS, if you installed the Collector in
/usr/local/bin/, then you would replace $OTEL_COLLECTOR_BINARY with
/usr/local/bin/otelcol.
Step 5 - Run the OpAMP Supervisor
Now it’s time to launch the supervisor, which in turn launches your OpenTelemetry Collector:
$ ./opampsupervisor --config=./supervisor.yaml
{"level":"info","ts":1745154644.746028,"logger":"supervisor","caller":"supervisor/supervisor.go:340","msg":"Supervisor starting","id":"01965352-9958-72da-905c-e40329c32c64"}
{"level":"info","ts":1745154644.74608,"logger":"supervisor","caller":"supervisor/supervisor.go:1086","msg":"No last received remote config found"}
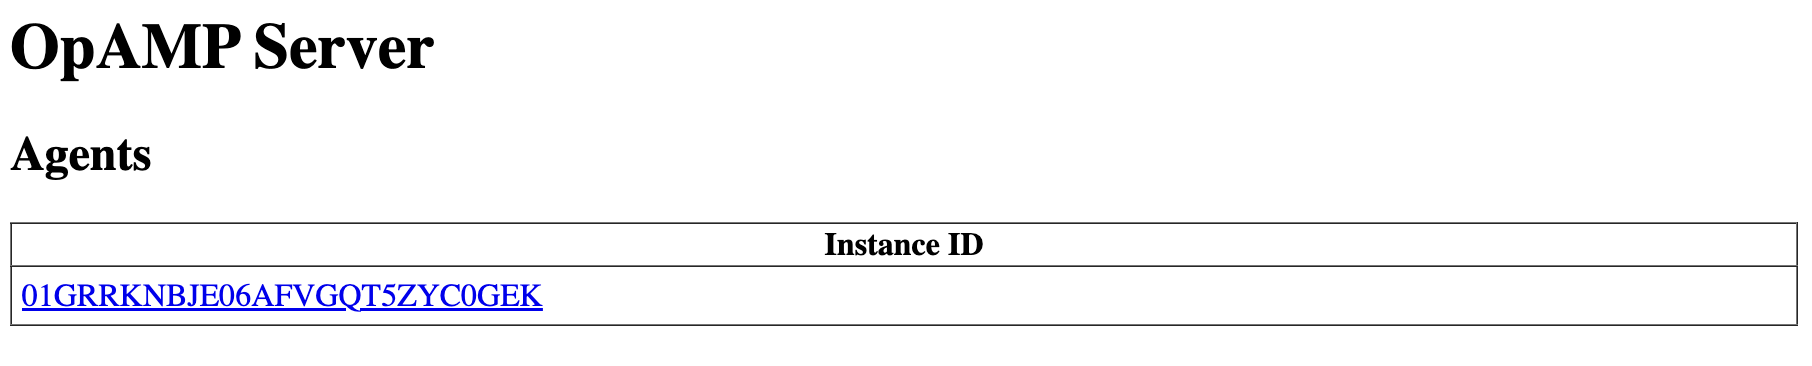
If everything worked out, you should now be able to go to http://localhost:4321/ and access the OpAMP server UI. You should see your Collector listed among the agents managed by the Supervisor:
Step 6 - Configure the OpenTelemetry Collector remotely
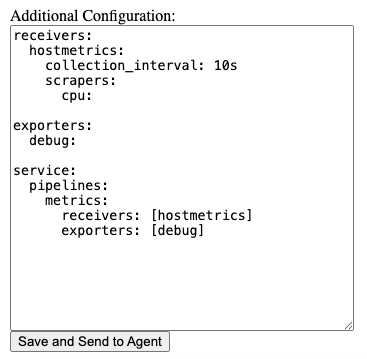
Click on the Collector in the server UI and paste the following content to the
Additional Configuration box:
receivers:
  host_metrics:
    collection_interval: 10s
    scrapers:
      cpu:

exporters:
  # NOTE: Prior to v0.86.0 use `logging` instead of `debug`.
  debug:
    verbosity: detailed

service:
  pipelines:
    metrics:
      receivers: [host_metrics]
      exporters: [debug]
Click Save and Send to Agent:
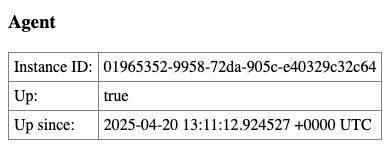
Reload the page and verify that the Agent status shows Up: true:
You can query the Collector for the metrics exported (note the label values):
$ curl localhost:8888/metrics
# HELP otelcol_exporter_send_failed_metric_points Number of metric points in failed attempts to send to destination. [alpha]
# TYPE otelcol_exporter_send_failed_metric_points counter
otelcol_exporter_send_failed_metric_points{exporter="debug",service_instance_id="01965352-9958-72da-905c-e40329c32c64",service_name="otelcol-contrib",service_version="0.124.1"} 0
# HELP otelcol_exporter_sent_metric_points Number of metric points successfully sent to destination. [alpha]
# TYPE otelcol_exporter_sent_metric_points counter
otelcol_exporter_sent_metric_points{exporter="debug",service_instance_id="01965352-9958-72da-905c-e40329c32c64",service_name="otelcol-contrib",service_version="0.124.1"} 132
# HELP otelcol_process_cpu_seconds Total CPU user and system time in seconds [alpha]
# TYPE otelcol_process_cpu_seconds counter
otelcol_process_cpu_seconds{service_instance_id="01965352-9958-72da-905c-e40329c32c64",service_name="otelcol-contrib",service_version="0.124.1"} 0.127965
...
You can also inspect the Collector’s logs:
$ cat ./storage/agent.log
{"level":"info","ts":"2025-04-20T15:11:12.996+0200","caller":"service@v0.124.0/service.go:199","msg":"Setting up own telemetry..."}
{"level":"info","ts":"2025-04-20T15:11:12.996+0200","caller":"builders/builders.go:26","msg":"Development component. May change in the future."}
{"level":"info","ts":"2025-04-20T15:11:12.997+0200","caller":"service@v0.124.0/service.go:266","msg":"Starting otelcol-contrib...","Version":"0.124.1","NumCPU":11}
{"level":"info","ts":"2025-04-20T15:11:12.997+0200","caller":"extensions/extensions.go:41","msg":"Starting extensions..."}
{"level":"info","ts":"2025-04-20T15:11:12.997+0200","caller":"extensions/extensions.go:45","msg":"Extension is starting..."}
{"level":"info","ts":"2025-04-20T15:11:13.022+0200","caller":"extensions/extensions.go:62","msg":"Extension started."}
{"level":"info","ts":"2025-04-20T15:11:13.022+0200","caller":"extensions/extensions.go:45","msg":"Extension is starting..."}
{"level":"info","ts":"2025-04-20T15:11:13.022+0200","caller":"healthcheckextension@v0.124.1/healthcheckextension.go:32","msg":"Starting health_check extension","config":{"Endpoint":"localhost:58760","TLSSetting":null,"CORS":null,"Auth":null,"MaxRequestBodySize":0,"IncludeMetadata":false,"ResponseHeaders":null,"CompressionAlgorithms":null,"ReadTimeout":0,"ReadHeaderTimeout":0,"WriteTimeout":0,"IdleTimeout":0,"Path":"/","ResponseBody":null,"CheckCollectorPipeline":{"Enabled":false,"Interval":"5m","ExporterFailureThreshold":5}}}
{"level":"info","ts":"2025-04-20T15:11:13.022+0200","caller":"extensions/extensions.go:62","msg":"Extension started."}
{"level":"info","ts":"2025-04-20T15:11:13.024+0200","caller":"healthcheck/handler.go:132","msg":"Health Check state change","status":"ready"}
{"level":"info","ts":"2025-04-20T15:11:13.024+0200","caller":"service@v0.124.0/service.go:289","msg":"Everything is ready. Begin running and processing data."}
{"level":"info","ts":"2025-04-20T15:11:14.025+0200","msg":"Metrics","resource metrics":1,"metrics":1,"data points":44}
Other information
- Blog posts:
- YouTube videos:
Feedback
Was this page helpful?
Thank you. Your feedback is appreciated!
Please let us know how we can improve this page. Your feedback is appreciated!