Build a receiver
OpenTelemetry defines distributed tracing as:
Traces that track the progression of a single request, known as a trace, as it is handled by services that make up an application. The request may be initiated by a user or an application. Distributed tracing is a form of tracing that traverses process, network, and security boundaries.
Although distributed traces are defined in an application-centric way, you can think of them as a timeline for any request that moves through your system. Each distributed trace shows how long a request took from start to finish and breaks down the steps taken to complete it.
If your system generates tracing telemetry, you can configure your OpenTelemetry Collector with a trace receiver designed to receive and convert that telemetry. The receiver converts your data from its original format into the OpenTelemetry trace model so the Collector can process it.
To implement a trace receiver, you need the following:
A
Configimplementation so the trace receiver can gather and validate its configurations in the Collector config.yaml.A
receiver.Factoryimplementation so the Collector can properly instantiate the trace receiver component.A
receiver.Tracesimplementation that collects the telemetry, converts it to the internal trace representation, and passes the telemetry to the next consumer in the pipeline.
This tutorial shows you how to create a trace receiver called tailtracer that
simulates a pull operation and generates traces as an outcome of that operation.
Setting up receiver development and testing environment
First, use the Building a Custom Collector
tutorial to create a Collector instance named otelcol-dev; all you need is to
copy the builder-config.yaml described in
Configure the OpenTelemetry Collector Builder
and run the builder. As an outcome, you should now have a folder structure like
this:
.
├── builder-config.yaml
├── ocb
└── otelcol-dev
    ├── components.go
    ├── components_test.go
    ├── go.mod
    ├── go.sum
    ├── main.go
    ├── main_others.go
    ├── main_windows.go
    └── otelcol-dev
To properly test your trace receiver, you may need a distributed tracing backend
so the Collector can send the telemetry to it. We will be using
Jaeger. If you
don’t have a Jaeger instance running, you can easily start one using Docker
with the following command:
docker run -d --name jaeger \
  -e COLLECTOR_OTLP_ENABLED=true \
  -p 16686:16686 \
  -p 14317:4317 \
  -p 14318:4318 \
  jaegertracing/all-in-one:1.41
Once the container is up and running, you can access Jaeger UI via this URL: http://localhost:16686/
Now, create a Collector config file named config.yaml to set up the Collector
components and pipelines.
touch config.yaml
For now, you just need a basic traces pipeline with the otlp receiver and the
otlp and debug exporters. Here is what your config.yaml file should look
like:
config.yaml
receivers:
  otlp:
    protocols:
      grpc:
        endpoint: 0.0.0.0:4317

exporters:
  debug:
    verbosity: detailed
  otlp/jaeger:
    endpoint: localhost:14317
    tls:
      insecure: true
    sending_queue:
      batch:

service:
  pipelines:
    traces:
      receivers: [otlp]
      exporters: [otlp/jaeger, debug]
  telemetry:
    logs:
      level: debug
Here, we use the insecure flag in the otlp exporter config for simplicity;
you should use TLS certificates for secure communication or mTLS for mutual
authentication when running the Collector in production, by following this
guide.
To verify that the Collector is properly set up, run this command:
./otelcol-dev/otelcol-dev --config config.yaml
The output may look like this:
2023-11-08T18:38:37.183+0800	info	service@v0.88.0/telemetry.go:84	Setting up own telemetry...
2023-11-08T18:38:37.185+0800	info	service@v0.88.0/telemetry.go:201	Serving Prometheus metrics	{"address": ":8888", "level": "Basic"}
2023-11-08T18:38:37.185+0800	debug	exporter@v0.88.0/exporter.go:273	Stable component.	{"kind": "exporter", "data_type": "traces", "name": "otlp/jaeger"}
2023-11-08T18:38:37.186+0800	info	exporter@v0.88.0/exporter.go:275	Development component. May change in the future.	{"kind": "exporter", "data_type": "traces", "name": "debug"}
2023-11-08T18:38:37.186+0800	debug	receiver@v0.88.0/receiver.go:294	Stable component.	{"kind": "receiver", "name": "otlp", "data_type": "traces"}
2023-11-08T18:38:37.186+0800	info	service@v0.88.0/service.go:143	Starting otelcol-dev...	{"Version": "1.0.0", "NumCPU": 10}

<OMITTED>

2023-11-08T18:38:37.189+0800	info	service@v0.88.0/service.go:169	Everything is ready. Begin running and processing data.
2023-11-08T18:38:37.189+0800	info	zapgrpc/zapgrpc.go:178	[core] [Server #3 ListenSocket #4] ListenSocket created	{"grpc_log": true}
2023-11-08T18:38:37.195+0800	info	zapgrpc/zapgrpc.go:178	[core] [Channel #1 SubChannel #2] Subchannel Connectivity change to READY	{"grpc_log": true}
2023-11-08T18:38:37.195+0800	info	zapgrpc/zapgrpc.go:178	[core] [pick-first-lb 0x140005efdd0] Received SubConn state update: 0x140005eff80, {ConnectivityState:READY ConnectionError:<nil>}	{"grpc_log": true}
2023-11-08T18:38:37.195+0800	info	zapgrpc/zapgrpc.go:178	[core] [Channel #1] Channel Connectivity change to READY	{"grpc_log": true}
If everything went well, the Collector instance should be up and running.
You may use the telemetrygen to further verify the setup. For example, open another console and run the following commands:
go install github.com/open-telemetry/opentelemetry-collector-contrib/cmd/telemetrygen@latest

telemetrygen traces --otlp-insecure --traces 1
You should be able to see detailed logs in the console and the traces in Jaeger UI via this URL: http://localhost:16686/.
Press Ctrl + C to stop the Collector instance in the Collector console.
Setting up Go module
Every Collector component should be created as a Go module. Let’s create a
tailtracer folder to host our receiver project and initialize it as Go module.
mkdir tailtracer
cd tailtracer
go mod init github.com/open-telemetry/opentelemetry-tutorials/trace-receiver/tailtracer
The module path above is a mock path, which can be your desired private or public path. See the initial trace-receiver code.
It is recommended to enable Go
Workspaces since we’re going to manage
multiple Go modules: the otelcol-dev and tailtracer, and possibly more
components over time.
cd ..
go work init
go work use otelcol-dev
go work use tailtracer
Designing and validating receiver settings
A receiver may have some configurable settings, which can be set via the Collector config file.
The tailtracer receiver will have the following settings:
interval: a string representing the time interval (in minutes) between telemetry pull operations.number_of_traces: the number of mock traces generated for each interval.
Here is what the tailtracer receiver settings will look like:
receivers:
  tailtracer: # this line represents the ID of your receiver
    interval: 1m
    number_of_traces: 1
Create a file named config.go under the folder tailtracer where you will
write all the code to support your receiver settings.
touch tailtracer/config.go
To implement the configuration aspects of a receiver, you need to create a
Config struct. Add the following code to your config.go file:
package tailtracer

type Config struct{

}
To be able to give your receiver access to its settings, the Config struct
must have a field for each of the receiver’s settings.
Here is what the config.go file should look like after you implemented the
requirements above:
tailtracer/config.go
package tailtracer

// Config represents the receiver config settings in the Collector config.yaml
type Config struct {
   Interval    string `mapstructure:"interval"`
   NumberOfTraces int `mapstructure:"number_of_traces"`
}
- Added the
Intervaland theNumberOfTracesfields to properly have access to their values from the config.yaml.
Now that you have access to the settings, you can provide any kind of validation
needed for those values by implementing the Validate method according to the
optional
ConfigValidator
interface.
In this case, the interval value will be optional (we will look at generating
default values later). But when defined, it should be at least 1 minute (1m) and
the number_of_traces will be a mandatory value. Here is what the config.go
looks like after implementing the Validate method:
tailtracer/config.go
package tailtracer

import (
	"fmt"
	"time"
)

// Config represents the receiver config settings in the Collector config.yaml
type Config struct {
	Interval       string `mapstructure:"interval"`
	NumberOfTraces int    `mapstructure:"number_of_traces"`
}

// Validate checks if the receiver configuration is valid
func (cfg *Config) Validate() error {
	interval, _ := time.ParseDuration(cfg.Interval)
	if interval.Minutes() < 1 {
		return fmt.Errorf("when defined, the interval has to be set to at least 1 minute (1m)")
	}

	if cfg.NumberOfTraces < 1 {
		return fmt.Errorf("number_of_traces must be greater or equal to 1")
	}
	return nil
}
- Imported the
fmtpackage to properly format print error messages. - Added the
Validatemethod to the Config struct to check if theintervalsetting value is at least 1 minute (1m), and if thenumber_of_tracessetting value is greater or equal to 1. If that is not true, the Collector will generate an error during its startup process and display the message accordingly.
If you want to take a closer look at the structs and interfaces involved in the configuration aspects of a component, refer to the component/config.go file inside the Collector GitHub project.
Implementing the receiver.Factory interface
The tailtracer receiver must provide a receiver.Factory implementation.
Although the receiver.Factory interface is defined in the
receiver/receiver.go
file within the Collector project, the right way to implement it is by using the
functions available in the go.opentelemetry.io/collector/receiver package.
Create a file named factory.go:
touch tailtracer/factory.go
Now, let’s follow the convention and add a function named NewFactory() that
will be responsible for instantiating the tailtracer factory. Go ahead and add
the following code to your factory.go file:
package tailtracer

import (
	"go.opentelemetry.io/collector/receiver"
)

// NewFactory creates a factory for tailtracer receiver.
func NewFactory() receiver.Factory {
	return nil
}
To instantiate your tailtracer receiver factory, you will use the following
function from the receiver package:
func NewFactory(cfgType component.Type, createDefaultConfig component.CreateDefaultConfigFunc, options ...FactoryOption) Factory
The receiver.NewFactory() instantiates and returns a receiver.Factory and it
requires the following parameters:
component.Type: a unique string identifier for your receiver across all Collector components.component.CreateDefaultConfigFunc: a reference to a function that returns thecomponent.Configinstance for your receiver....FactoryOption: the slice ofreceiver.FactoryOptions that will determine what type of signal your receiver is capable of processing.
Let’s now implement the code to support all the parameters required by
receiver.NewFactory().
Identifying and providing default settings
Previously, we mentioned that the interval setting for the tailtracer
receiver would be optional. You will need to provide a default value for it so
it can be used as part of the default settings.
Go ahead and add the following code to your factory.go file:
var (
	typeStr         = component.MustNewType("tailtracer")
)

const (
	defaultInterval = 1 * time.Minute
)
As for default settings, you just need to add a function that returns a
component.Config holding the default configurations for the tailtracer
receiver.
To accomplish that, go ahead and add the following code to your factory.go
file:
func createDefaultConfig() component.Config {
	return &Config{
		Interval: string(defaultInterval),
	}
}
After these two changes you will notice a few imports are missing, so here is
what your factory.go file should look like with the proper imports:
tailtracer/factory.go
package tailtracer

import (
	"time"

	"go.opentelemetry.io/collector/component"
	"go.opentelemetry.io/collector/receiver"
)

var (
	typeStr         = component.MustNewType("tailtracer")
)

const (
	defaultInterval = 1 * time.Minute
)

func createDefaultConfig() component.Config {
	return &Config{
		Interval: string(defaultInterval),
	}
}

// NewFactory creates a factory for tailtracer receiver.
func NewFactory() receiver.Factory {
	return nil
}
- Imported the
timepackage to support the time.Duration type for the defaultInterval. - Imported the
go.opentelemetry.io/collector/componentpackage, which is wherecomponent.Configis declared. - Imported the
go.opentelemetry.io/collector/receiverpackage, which is wherereceiver.Factoryis declared. - Added a
time.Durationconstant calleddefaultIntervalto represent the default value for our receiver’sIntervalsetting. We will be setting the default value for 1 minute, hence the assignment of1 * time.Minuteas its value. - Added a function named
createDefaultConfig, which is responsible for returning acomponent.Configimplementation, which in this case is going to be an instance of ourtailtracer.Configstruct. - The
tailtracer.Config.Intervalfield was initialized with thedefaultIntervalconstant.
Specifying the receiver’s capabilities
A receiver component can process traces, metrics, and logs. The receiver’s factory is responsible for specifying the capabilities that the receiver would provide.
Given that tracing is the subject of this tutorial, we will enable the
tailtracer receiver to work with traces only. The receiver package provides
the following function and type to help the factory describe the trace
processing capabilities:
func WithTraces(createTracesReceiver CreateTracesFunc, sl component.StabilityLevel) FactoryOption
The receiver.WithTraces() instantiates and returns a receiver.FactoryOption
and it requires the following parameters:
createTracesReceiver: A reference to a function that matches thereceiver.CreateTracesFunctype. Thereceiver.CreateTracesFunctype is a pointer to a function that is responsible for instantiating and returning areceiver.Tracesinstance, and it requires the following parameters:context.Context: the reference to the Collectorcontext.Context, so your trace receiver can properly manage its execution context.receiver.Settings: the reference to some of the Collector settings under which your receiver is created.component.Config: the reference for the receiver config settings passed by the Collector to the factory so it can properly read its settings from the Collector config.consumer.Traces: the reference to the nextconsumer.Tracesin the pipeline, which is where received traces will go. This is either a processor or an exporter.
Start by adding the bootstrap code to properly implement the
receiver.CreateTracesFunc function pointer. Go ahead and add the following
code to your factory.go file:
func createTracesReceiver(_ context.Context, params receiver.Settings, baseCfg component.Config, consumer consumer.Traces) (receiver.Traces, error) {
	return nil, nil
}
You now have all the necessary components to successfully instantiate your
receiver factory using the receiver.NewFactory function. Go ahead and update
your NewFactory() function in the factory.go file as follows:
// NewFactory creates a factory for tailtracer receiver.
func NewFactory() receiver.Factory {
	return receiver.NewFactory(
		typeStr,
		createDefaultConfig,
		receiver.WithTraces(createTracesReceiver, component.StabilityLevelAlpha))
}
After these changes, you will notice a few imports are missing, so here is what
your factory.go file should look like with the proper imports:
tailtracer/factory.go
package tailtracer

import (
	"context"
	"time"

	"go.opentelemetry.io/collector/component"
	"go.opentelemetry.io/collector/consumer"
	"go.opentelemetry.io/collector/receiver"
)

var (
	typeStr         = component.MustNewType("tailtracer")
)

const (
	defaultInterval = 1 * time.Minute
)

func createDefaultConfig() component.Config {
	return &Config{
		Interval: string(defaultInterval),
	}
}

func createTracesReceiver(_ context.Context, params receiver.Settings, baseCfg component.Config, consumer consumer.Traces) (receiver.Traces, error) {
	return nil, nil
}

// NewFactory creates a factory for tailtracer receiver.
func NewFactory() receiver.Factory {
	return receiver.NewFactory(
		typeStr,
		createDefaultConfig,
		receiver.WithTraces(createTracesReceiver, component.StabilityLevelAlpha))
}
- Imported the
contextpackage to support thecontext.Contexttype referenced in thecreateTracesReceiverfunction. - Imported the
go.opentelemetry.io/collector/consumerpackage to support theconsumer.Tracestype referenced in thecreateTracesReceiverfunction. - Updated the
NewFactory()function so it returns thereceiver.Factorygenerated by thereceiver.NewFactory()call with the required parameters. The generated receiver factory will be capable of processing traces via the call toreceiver.WithTraces(createTracesReceiver, component.StabilityLevelAlpha)
Implementing the receiver component
All the receiver APIs are currently declared in the receiver/receiver.go file in the Collector project. Open the file and take a minute to browse through all the interfaces.
Notice that receiver.Traces (and its siblings receiver.Metrics and
receiver.Logs) at this point, doesn’t describe any specific methods other than
the ones it “inherits” from component.Component.
It may feel weird, but remember, the Collector API was meant to be extensible. The components and their signals may evolve in different ways, so the role of those interfaces exists to help support that.
To create a receiver.Traces, you need to implement the following methods
described by component.Component interface:
Start(ctx context.Context, host Host) error
Shutdown(ctx context.Context) error
Both methods act as event handlers used by the Collector to communicate with its components as part of their lifecycle.
The Start() method represents a signal of the Collector telling the component
to start its processing. As part of the event, the Collector will pass the
following information:
context.Context: Most of the time, a receiver will be processing a long-running operation, so the recommendation is to ignore this context and actually create a new one from context.Background().Host: The host is meant to enable the receiver to communicate with the Collector host once it is up and running.
The Shutdown() method represents a signal of the Collector telling the
component that the service is getting shutdown and as such, the component should
stop its processing and make all the necessary cleanup work required:
context.Context: the context passed by the Collector as part of the shutdown operation.
You will start the implementation by creating a new file called
trace-receiver.go in tailtracer folder:
touch tailtracer/trace-receiver.go
And then add the declaration to a type called tailtracerReceiver as follows:
type tailtracerReceiver struct{

}
Now that you have the tailtracerReceiver type, you can implement the Start()
and Shutdown() methods so the receiver type can be compliant with the
receiver.Traces interface.
tailtracer/trace-receiver.go
package tailtracer

import (
	"context"
	"go.opentelemetry.io/collector/component"
)

type tailtracerReceiver struct {
}

func (tailtracerRcvr *tailtracerReceiver) Start(ctx context.Context, host component.Host) error {
	return nil
}

func (tailtracerRcvr *tailtracerReceiver) Shutdown(ctx context.Context) error {
	return nil
}
- Imported the
contextpackage which is where theContexttype and functions are declared. - Imported the
go.opentelemetry.io/collector/componentpackage which is where theHosttype is declared. - Added a bootstrap implementation of the
Start(ctx context.Context, host component.Host)method to comply with thereceiver.Tracesinterface. - Added a bootstrap implementation of the
Shutdown(ctx context.Context)method to comply with thereceiver.Tracesinterface.
The Start() method is passing 2 references (context.Context and
component.Host) that your receiver may need to keep so they can be used as
part of its processing operations.
The context.Context reference should be used for creating a new context to
support the receiver processing operations. You will need to decide the best way
to handle context cancellation so you can finalize it properly as part of the
component’s shutdown in the Shutdown() method.
The component.Host can be useful during the whole lifecycle of the receiver so
keep that reference in the tailtracerReceiver type.
Here is what the tailtracerReceiver type declaration will look like after you
include the fields for keeping the references suggested above:
type tailtracerReceiver struct {
	host   component.Host
	cancel context.CancelFunc
}
Now you need to update the Start() method so the receiver can properly
initialize its own processing context, keep the cancellation function in the
cancel field, and initialize its host field value. You will also update the
Stop() method to finalize the context by calling the cancel function.
Here is what the trace-receiver.go file looks like after making the changes:
tailtracer/trace-receiver.go
package tailtracer

import (
	"context"
	"go.opentelemetry.io/collector/component"
)

type tailtracerReceiver struct {
	host   component.Host
	cancel context.CancelFunc
}

func (tailtracerRcvr *tailtracerReceiver) Start(ctx context.Context, host component.Host) error {
	tailtracerRcvr.host = host
	ctx = context.Background()
	ctx, tailtracerRcvr.cancel = context.WithCancel(ctx)

	return nil
}

func (tailtracerRcvr *tailtracerReceiver) Shutdown(ctx context.Context) error {
	if tailtracerRcvr.cancel != nil {
		tailtracerRcvr.cancel()
	}
	return nil
}
Updated the Start() method by adding the initialization to the host field
with the component.Host reference passed by the Collector.
- Set the
cancelfunction field with the cancellation based on a new context created withcontext.Background()(according to the Collector API documentation suggestions). - Updated the
Shutdown()method by adding a call to thecancel()context cancellation function.
Keeping information passed by the receiver’s factory
Now that you have implemented the receiver.Traces interface methods, your
tailtracer receiver component is ready to be instantiated and returned by its
factory.
Open the tailtracer/factory.go file and navigate to the
createTracesReceiver() function. Notice that the factory will pass references
as part of the createTracesReceiver() function parameters that your receiver
requires to work properly. These include its configuration settings
(component.Config), the next Consumer in the pipeline that will consume the
generated traces (consumer.Traces), and the Collector logger. This is so that
the tailtracer receiver can add meaningful events to it (receiver.Settings).
Given that all this information will only be made available to the receiver at
the moment it is instantiated by the factory, the tailtracerReceiver type will
need fields to keep that information and use it in other stages of its
lifecycle.
Here is what the trace-receiver.go file looks like with the updated
tailtracerReceiver type declaration:
tailtracer/trace-receiver.go
package tailtracer

import (
	"context"
	"time"
	"go.opentelemetry.io/collector/component"
	"go.opentelemetry.io/collector/consumer"
	"go.uber.org/zap"
)

type tailtracerReceiver struct {
	host         component.Host
	cancel       context.CancelFunc
	logger       *zap.Logger
	nextConsumer consumer.Traces
	config       *Config
}

func (tailtracerRcvr *tailtracerReceiver) Start(ctx context.Context, host component.Host) error {
	tailtracerRcvr.host = host
	ctx = context.Background()
	ctx, tailtracerRcvr.cancel = context.WithCancel(ctx)

	interval, _ := time.ParseDuration(tailtracerRcvr.config.Interval)
	go func() {
		ticker := time.NewTicker(interval)
		defer ticker.Stop()

		for {
			select {
				case <-ticker.C:
					tailtracerRcvr.logger.Info("I should start processing traces now!")
				case <-ctx.Done():
					return
			}
		}
	}()

	return nil
}

func (tailtracerRcvr *tailtracerReceiver) Shutdown(ctx context.Context) error {
	if tailtracerRcvr.cancel != nil {
		tailtracerRcvr.cancel()
	}
	return nil
}
- Imported the
go.opentelemetry.io/collector/consumerwhich is where the pipeline’s consumer types and interfaces are declared. - Imported the
go.uber.org/zappackage, which is what the Collector uses for its debugging capabilities. - Added a
zap.Loggerfield namedloggerso we can have access to the Collector logger reference from within the receiver. - Added a
consumer.Tracesfield namednextConsumerso we can push the traces generated by thetailtracerreceiver to the next consumer, declared in the Collector pipeline. - Added a
Configfield namedconfigso we can have access to receiver’s configuration settings defined in the Collector config. - Added a variable named
intervalthat is initialized as atime.Durationbased on the value of theintervalsettings of thetailtracerreceiver, defined in the Collector config. - Added a
go func()to implement thetickermechanism so the receiver can generate traces every time thetickerreaches the amount of time specified by theintervalvariable. - Used the
tailtracerRcvr.loggerfield to generate an info message every time the receiver is supposed to generate traces.
The tailtracerReceiver type is ready to be instantiated and will keep all
meaningful information passed by its factory.
Open the tailtracer/factory.go file and navigate to the
createTracesReceiver() function.
The receiver is only instantiated if it is declared as a component in a pipeline, and the factory is responsible to make sure the next consumer (either a processor or exporter) in the pipeline is valid. Otherwise, it should generate an error.
The createTracesReceiver() function will need a guard clause to make that
validation.
You will also need variables to properly initialize the config and the
logger fields of the tailtracerReceiver instance.
Here is what the factory.go file looks like with the updated
createTracesReceiver() function:
tailtracer/factory.go
package tailtracer

import (
	"context"
	"time"

	"go.opentelemetry.io/collector/component"
	"go.opentelemetry.io/collector/consumer"
	"go.opentelemetry.io/collector/receiver"
)

var (
	typeStr         = component.MustNewType("tailtracer")
)

const (
	defaultInterval = 1 * time.Minute
)

func createDefaultConfig() component.Config {
	return &Config{
		Interval: string(defaultInterval),
	}
}

func createTracesReceiver(_ context.Context, params receiver.Settings, baseCfg component.Config, consumer consumer.Traces) (receiver.Traces, error) {

	logger := params.Logger
	tailtracerCfg := baseCfg.(*Config)

	traceRcvr := &tailtracerReceiver{
		logger:       logger,
		nextConsumer: consumer,
		config:       tailtracerCfg,
	}

	return traceRcvr, nil
}

// NewFactory creates a factory for tailtracer receiver.
func NewFactory() receiver.Factory {
	return receiver.NewFactory(
		typeStr,
		createDefaultConfig,
		receiver.WithTraces(createTracesReceiver, component.StabilityLevelAlpha))
}
- Added a variable called
loggerand initialized it with the Collector logger that is available as a field namedLogger, in thereceiver.Settingsreference. - Added a variable called
tailtracerCfgand initialized it by casting thecomponent.Configreference to thetailtracerreceiverConfig. - Added a variable called
traceRcvrand initialized it with thetailtracerReceiverinstance using the factory information stored in the variables. - Updated the return statement to include the
traceRcvrinstance.
So far, the skeleton of the receiver has been fully implemented.
Updating the Collector initialization process with the receiver
For the receiver to participate in the Collector pipelines, we need to make some
updates in the generated otelcol-dev/components.go file where all the
Collector components are registered and instantiated.
The tailtracer receiver factory instance has to be added to the factories
map so the Collector can load it properly as part of its initialization process.
Here is what the components.go file looks like after making the changes to
support that:
otelcol-dev/components.go
// Code generated by "go.opentelemetry.io/collector/cmd/builder". DO NOT EDIT.

package main

import (
	"go.opentelemetry.io/collector/exporter"
	"go.opentelemetry.io/collector/extension"
	"go.opentelemetry.io/collector/otelcol"
	"go.opentelemetry.io/collector/processor"
	"go.opentelemetry.io/collector/receiver"
	debugexporter "go.opentelemetry.io/collector/exporter/debugexporter"
	otlpexporter "go.opentelemetry.io/collector/exporter/otlpexporter"
	otlpreceiver "go.opentelemetry.io/collector/receiver/otlpreceiver"
	tailtracer "github.com/open-telemetry/opentelemetry-tutorials/trace-receiver/tailtracer" // newly added line
)

func components() (otelcol.Factories, error) {
	var err error
	factories := otelcol.Factories{}

	factories.Extensions, err = otelcol.MakeFactoryMap[extension.Factory](
	)
	if err != nil {
		return otelcol.Factories{}, err
	}

	factories.Receivers, err = otelcol.MakeFactoryMap[receiver.Factory](
		otlpreceiver.NewFactory(),
		tailtracer.NewFactory(), // newly added line
	)
	if err != nil {
		return otelcol.Factories{}, err
	}

	factories.Exporters, err = otelcol.MakeFactoryMap[exporter.Factory](
		debugexporter.NewFactory(),
		otlpexporter.NewFactory(),
	)
	if err != nil {
		return otelcol.Factories{}, err
	}

	factories.Processors, err = otelcol.MakeFactoryMap[processor.Factory](
	)
	if err != nil {
		return otelcol.Factories{}, err
	}

	return factories, nil
}
- Imported the receiver module
github.com/open-telemetry/opentelemetry-tutorials/trace-receiver/tailtracer, which is where the receiver types and functions are. - Added a call to
tailtracer.NewFactory()as a parameter of theotelcol.MakeFactoryMap()call so yourtailtracerreceiver factory is properly added to thefactoriesmap.
Running and debugging the receiver
Ensure that the Collector config.yaml has been updated properly with the
tailtracer receiver configured as one of the receivers used in the
pipeline(s).
config.yaml
receivers:
  otlp:
    protocols:
      grpc:
        endpoint: 0.0.0.0:4317
  tailtracer: # this line represents the ID of your receiver
    interval: 1m
    number_of_traces: 1

exporters:
  debug:
    verbosity: detailed
  otlp/jaeger:
    endpoint: localhost:14317
    tls:
      insecure: true
    sending_queue:
      batch:

service:
  pipelines:
    traces:
      receivers: [otlp, tailtracer]
      exporters: [otlp/jaeger, debug]
  telemetry:
    logs:
      level: debug
Let’s use the go run command instead of the previously generated
./otelcol-dev/otelcol-dev binary file, to start the updated Collector as we
have had code changes in the otelcol-dev/components.go file.
go run ./otelcol-dev --config config.yaml
The output should look like this:
2023-11-08T21:38:36.621+0800	info	service@v0.88.0/telemetry.go:84	Setting up own telemetry...
2023-11-08T21:38:36.621+0800	info	service@v0.88.0/telemetry.go:201	Serving Prometheus metrics	{"address": ":8888", "level": "Basic"}
2023-11-08T21:38:36.621+0800	info	exporter@v0.88.0/exporter.go:275	Development component. May change in the future.	{"kind": "exporter", "data_type": "traces", "name": "debug"}
2023-11-08T21:38:36.621+0800	debug	exporter@v0.88.0/exporter.go:273	Stable component.	{"kind": "exporter", "data_type": "traces", "name": "otlp/jaeger"}
2023-11-08T21:38:36.621+0800	debug	receiver@v0.88.0/receiver.go:294	Stable component.	{"kind": "receiver", "name": "otlp", "data_type": "traces"}
2023-11-08T21:38:36.621+0800	debug	receiver@v0.88.0/receiver.go:294	Alpha component. May change in the future.	{"kind": "receiver", "name": "tailtracer", "data_type": "traces"}
2023-11-08T21:38:36.622+0800	info	service@v0.88.0/service.go:143	Starting otelcol-dev...	{"Version": "1.0.0", "NumCPU": 10}
2023-11-08T21:38:36.622+0800	info	extensions/extensions.go:33	Starting extensions...

<OMITTED>

2023-11-08T21:38:36.636+0800	info	zapgrpc/zapgrpc.go:178	[core] [Channel #1] Channel Connectivity change to READY	{"grpc_log": true}
2023-11-08T21:39:36.626+0800	info	tailtracer/trace-receiver.go:33	I should start processing traces now!	{"kind": "receiver", "name": "tailtracer", "data_type": "traces"}
2023-11-08T21:40:36.626+0800	info	tailtracer/trace-receiver.go:33	I should start processing traces now!	{"kind": "receiver", "name": "tailtracer", "data_type": "traces"}
...
As you can see from the logs, the tailtracer has been initialized
successfully. Every minute, there will be a message that reads,
I should start processing traces now!, triggered by the dummy ticker in
tailtracer/trace-receiver.go.
To stop the process press Ctrl + C in your Collector terminal.
Additionally, you may use your IDE of choice to debug the receiver, just as you
would normally debug a Go project. Here is a simple launch.json file for
Visual Studio Code for your reference:
{
  "version": "0.2.0",
  "configurations": [
    {
      "name": "Launch otelcol-dev",
      "type": "go",
      "request": "launch",
      "mode": "auto",
      "program": "${workspaceFolder}/otelcol-dev",
      "args": ["--config", "${workspaceFolder}/config.yaml"]
    }
  ]
}
As a big milestone, let’s take a look at how the folder structure looks like now:
.
├── builder-config.yaml
├── config.yaml
├── go.work
├── go.work.sum
├── ocb
├── otelcol-dev
│   ├── components.go
│   ├── components_test.go
│   ├── go.mod
│   ├── go.sum
│   ├── main.go
│   ├── main_others.go
│   ├── main_windows.go
│   └── otelcol-dev
└── tailtracer
    ├── config.go
    ├── factory.go
    ├── go.mod
    └── trace-receiver.go
In the next section, you will learn more about the OpenTelemetry Trace data
model so the tailtracer receiver can finally generate meaningful traces!
The Collector Trace Data Model
You may be familiar with OpenTelemetry traces by using the SDKs and instrumenting an application to observe and evaluate your traces in a distributed tracing backend like Jaeger.
Here is what a trace looks like in Jaeger:
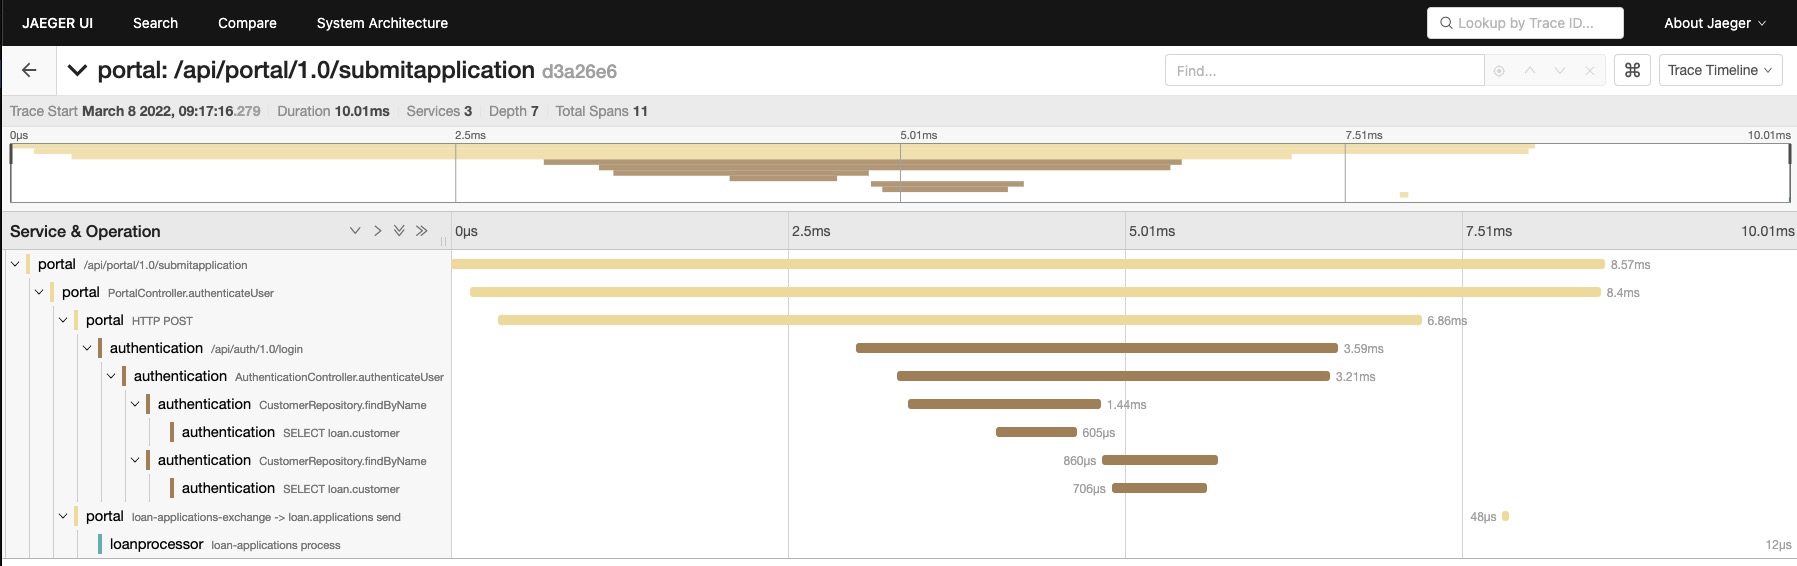
Although this is a Jaeger trace, it was generated by a trace pipeline in the Collector. This can help you understand a few things about the OTel trace data model:
- A trace consists of one or more spans structured in a hierarchy to represent dependencies.
- The spans can represent operations within a service and/or across services.
Creating a trace in the trace receiver will be slightly different from how you would do it with the SDKs, so let’s begin by reviewing the high level concepts.
Working with Resources
In the OTel world, all telemetry is generated by a Resource. Here is the
definition according to the OTel spec:
A
Resourceis an immutable representation of the entity producing telemetry as Attributes. For example, a process producing telemetry that is running in a container on Kubernetes has a Pod name, runs in a namespace and may be part of a Deployment with its own name. All three of these attributes can be included in theResource.
Traces are most commonly used to represent a service request (the Services
entity described in Jaeger’s model), which is normally implemented as processes
running in a compute unit. However, OTel’s API approach to describe a Resource
through attributes, is flexible enough to represent any entity that you may
need, such as ATMs, IoT sensors, and much more.
So it’s safe to say that for a trace to exist, a Resource will have to start
it.
In this tutorial, we will simulate a system with telemetry that demonstrates
ATMs located in 2 different states (for example, Illinois and California)
accessing the Account’s backend system to execute balance, deposit and
withdrawal operations. To achieve this, we will implement code to create the
Resource types representing the ATM and the backend system.
Go ahead and create a file named model.go inside the tailtracer folder.
touch tailtracer/model.go
Now, in the model.go file, add the definition for the Atm and the
BackendSystem types as follows:
tailtracer/model.go
package tailtracer

type Atm struct{
	ID           int64
	Version      string
	Name         string
	StateID      string
	SerialNumber string
	ISPNetwork   string
}

type BackendSystem struct{
	Version       string
	ProcessName   string
	OSType        string
	OSVersion     string
	CloudProvider string
	CloudRegion   string
	Endpoint      string
}
These types are meant to represent the entities as they appear in the system
being observed. They contain information that would be quite meaningful to add
to the traces as part of the Resource definition. You will add some helper
functions to generate the instances of these types.
Here is what the model.go file will look like with the added helper functions:
tailtracer/model.go
package tailtracer

import (
	"math/rand"
)

type Atm struct{
	ID           int64
	Version      string
	Name         string
	StateID      string
	SerialNumber string
	ISPNetwork   string
}

type BackendSystem struct{
	Version       string
	ProcessName   string
	OSType        string
	OSVersion     string
	CloudProvider string
	CloudRegion   string
	Endpoint      string
}

func generateAtm() Atm{
	i := getRandomNumber(1, 2)
	var newAtm Atm

	switch i {
		case 1:
			newAtm = Atm{
				ID: 111,
				Name: "ATM-111-IL",
				SerialNumber: "atmxph-2022-111",
				Version: "v1.0",
				ISPNetwork: "comcast-chicago",
				StateID: "IL",

			}

		case 2:
			newAtm = Atm{
				ID: 222,
				Name: "ATM-222-CA",
				SerialNumber: "atmxph-2022-222",
				Version: "v1.0",
				ISPNetwork: "comcast-sanfrancisco",
				StateID: "CA",
			}
	}

	return newAtm
}

func generateBackendSystem() BackendSystem{
	i := getRandomNumber(1, 3)

	newBackend := BackendSystem{
		ProcessName: "accounts",
		Version: "v2.5",
		OSType: "lnx",
		OSVersion: "4.16.10-300.fc28.x86_64",
		CloudProvider: "amzn",
		CloudRegion: "us-east-2",
	}

	switch i {
		case 1:
		 	newBackend.Endpoint = "api/v2.5/balance"
		case 2:
		  	newBackend.Endpoint = "api/v2.5/deposit"
		case 3:
			newBackend.Endpoint = "api/v2.5/withdrawn"

	}

	return newBackend
}

func getRandomNumber(min int, max int) int {
	i := (rand.Intn(max - min + 1) + min)
	return i
}
- Imported the
math/randpackage to support the implementation of thegenerateRandomNumberfunction. - Added the
generateAtmfunction, that instantiates anAtmtype and randomly assigns either Illinois or California as the value forStateID, along with the corresponding value forISPNetwork. - Added the
generateBackendSystemfunction, which creates an instance of theBackendSystemtype and randomly assigns service endpoint values to theEndpointfield. - Added the
generateRandomNumberfunction to generate random numbers within a specified range.
Now that you have the functions to generate object instances representing the entities generating telemetry, you are ready to represent those entities in the OTel Collector world.
The Collector API provides a package named ptrace, which is nested under the
pdata package. It includes all the types, interfaces and helper functions
required to work with traces in the Collector pipeline components.
Open the tailtracer/model.go file and add
go.opentelemetry.io/collector/pdata/ptrace to the import clause so you can
have access to the ptrace package capabilities.
Before you can define a Resource, you need to create a ptrace.Traces that
will be responsible for propagating the traces via the Collector pipeline. You
can use the helper function ptrace.NewTraces(), to instantiate it. You will
also need to create instances of the Atm and BackendSystem types so you can
have data to represent the telemetry sources involved in your trace.
Open the tailtracer/model.go file and add the following function to it:
func generateTraces(numberOfTraces int) ptrace.Traces{
	traces := ptrace.NewTraces()

	for i := 0; i < numberOfTraces; i++{
		newAtm := generateAtm()
		newBackendSystem := generateBackendSystem()
	}

	return traces
}
By now, you have heard and read enough about how traces are made up of spans. You may have even written some instrumentation code using the SDK’s functions and types available to create them. However, what you may not know is that there are other types of “spans” involved in the creation of a trace in the Collector API.
You will start with a type called ptrace.ResourceSpans which represents the
resource and all the operations that it originated or received while
participating in a trace. You can find its definition in the
/pdata/ptrace/generated_resourcespans.go
file.
ptrace.Traces has a method named ResourceSpans() which returns an instance
of a helper type called ptrace.ResourceSpansSlice. The
ptrace.ResourceSpansSlice type has methods to help you handle the array of
ptrace.ResourceSpans. The array will contain as many items as the number of
Resource entities participating in the request represented by the trace.
ptrace.ResourceSpansSlice has a method named AppendEmpty() that adds a new
ptrace.ResourceSpan to the array and returns its reference.
Once you have an instance of a ptrace.ResourceSpan, you will use a method
named Resource() which will return the instance of the pcommon.Resource
associated with the ResourceSpan.
Update the generateTrace() function with the following changes:
- add a variable named
resourceSpanto represent theResourceSpan. - add a variable named
atmResourceto represent thepcommon.Resourceassociated with theResourceSpan. - Use the methods mentioned above to initialize both variables, respectively.
Here is what the function should look like after you implement the changes:
func generateTraces(numberOfTraces int) ptrace.Traces{
	traces := ptrace.NewTraces()

	for i := 0; i < numberOfTraces; i++{
		newAtm := generateAtm()
		newBackendSystem := generateBackendSystem()

		resourceSpan := traces.ResourceSpans().AppendEmpty()
		atmResource := resourceSpan.Resource()
	}

	return traces
}
- Added the
resourceSpanvariable and initialized it with theResourceSpanreference returned by thetraces.ResourceSpans().AppendEmpty()call. - Added the
atmResourcevariable and initialized it with thepcommon.Resourcereference returned by theresourceSpan.Resource()call.
Describing Resources through attributes
The Collector API provides a package named pcommon, which is nested under the
pdata package. It contains all the types and helper functions required to
describe a Resource.
In the context of the Collector, a Resource is described by attributes in a
key/value pair format represented by the pcommon.Map type.
You can refer to the definition of the pcommon.Map type and its related helper
functions for creating attribute values using the supported formats in the
/pdata/pcommon/map.go
file in the Collector GitHub project.
Key/value pairs provide a lot of flexibility to help model your Resource data.
The OTel specification has some guidelines in place to help organize and
minimize the conflicts across all the different types of telemetry generation
entities that it may need to represent.
These guidelines are known as Resource Semantic Conventions and are documented in the OTel specification.
When creating your own attributes to represent your own telemetry generation entities, you should follow the guidelines provided by the specification:
Attributes are grouped logically by the type of concept that they describe. Attributes in the same group have a common prefix that ends with a dot. For example, all attributes that describe Kubernetes properties start with
k8s.
Let’s start by opening the tailtracer/model.go file and adding
go.opentelemetry.io/collector/pdata/pcommon to the import clause so you can
have access to the pcommon package capabilities.
Now, go ahead and add a function to read the field values from an Atm instance
and write them as attributes (grouped by the prefix “atm.”) into a
pcommon.Resource instance. Here is what the function looks like:
func fillResourceWithAtm(resource *pcommon.Resource, atm Atm){
   atmAttrs := resource.Attributes()
   atmAttrs.PutInt("atm.id", atm.ID)
   atmAttrs.PutStr("atm.stateid", atm.StateID)
   atmAttrs.PutStr("atm.ispnetwork", atm.ISPNetwork)
   atmAttrs.PutStr("atm.serialnumber", atm.SerialNumber)
}
- Declared a variable called
atmAttrsand initialized it with thepcommon.Mapreference returned by theresource.Attributes()call. - Used the
PutInt()andPutStr()methods frompcommon.Mapto add int and string attributes based on the equivalentAtmfield types. Notice that because these attributes are specific to and only represent theAtmentity, they are all grouped within theatm.prefix.
The resource semantic conventions also have prescriptive attribute names and well-known values to represent telemetry generation entities that are common and applicable across different domains such as compute unit, environment and others.
For the BackendSystem entity, it has fields representing information relating
to Operating System and
Cloud. We will use the attribute names
and values specified by the resource semantic convention to represent this
information on its Resource.
The resource semantic convention keys and well-known values are defined by the
OpenTelemetry semantic conventions package:
go.opentelemetry.io/otel/semconv/v1.38.0.
Let’s create a function to read the field values from a BackendSystem instance
and write them as attributes into a pcommon.Resource instance. Open the
tailtracer/model.go file and add the following function:
func fillResourceWithBackendSystem(resource *pcommon.Resource, backend BackendSystem){
	backendAttrs := resource.Attributes()
	var osType, cloudProvider string

	switch {
		case backend.CloudProvider == "amzn":
			cloudProvider = semconv.CloudProviderAWS.Value.AsString()
		case backend.CloudProvider == "mcrsft":
			cloudProvider = semconv.CloudProviderAzure.Value.AsString()
		case backend.CloudProvider == "gogl":
			cloudProvider = semconv.CloudProviderGCP.Value.AsString()
	}

	backendAttrs.PutStr(string(semconv.CloudProviderKey), cloudProvider)
	backendAttrs.PutStr(string(semconv.CloudRegionKey), backend.CloudRegion)

	switch {
		case backend.OSType == "lnx":
			osType = semconv.OSTypeLinux.Value.AsString()
		case backend.OSType == "wndws":
			osType = semconv.OSTypeWindows.Value.AsString()
		case backend.OSType == "slrs":
			osType = semconv.OSTypeSolaris.Value.AsString()
	}

	backendAttrs.PutStr(string(semconv.OSTypeKey), osType)
	backendAttrs.PutStr(string(semconv.OSVersionKey), backend.OSVersion)
 }
Notice that we didn’t add an attribute named “atm.name” or “backendsystem.name”
to the pcommon.Resource representing the Atm and BackendSystem entity
names. This is because most (not to say all) distributed tracing backend systems
compatible with the OTel trace specification interpret the pcommon.Resource
described in a trace as a Service. Therefore, they expect the
pcommon.Resource to have a required attribute named service.name as
prescribed by the resource semantic convention.
We will also use a non-required attribute named service.version to represent
the version information for both the Atm and BackendSystem entities.
Here is what the tailtracer/model.go file looks like after adding the code for
properly assigning the “service.” group attributes:
tailtracer/model.go
package tailtracer

import (
	"math/rand"
	"time"

	"go.opentelemetry.io/collector/pdata/pcommon"
	"go.opentelemetry.io/collector/pdata/ptrace"
	"go.opentelemetry.io/otel/semconv/v1.38.0"
)

type Atm struct {
	ID           int64
	Version      string
	Name         string
	StateID      string
	SerialNumber string
	ISPNetwork   string
}

type BackendSystem struct {
	Version       string
	ProcessName   string
	OSType        string
	OSVersion     string
	CloudProvider string
	CloudRegion   string
	Endpoint      string
}

func generateAtm() Atm {
	i := getRandomNumber(1, 2)
	var newAtm Atm

	switch i {
	case 1:
		newAtm = Atm{
			ID:           111,
			Name:         "ATM-111-IL",
			SerialNumber: "atmxph-2022-111",
			Version:      "v1.0",
			ISPNetwork:   "comcast-chicago",
			StateID:      "IL",
		}

	case 2:
		newAtm = Atm{
			ID:           222,
			Name:         "ATM-222-CA",
			SerialNumber: "atmxph-2022-222",
			Version:      "v1.0",
			ISPNetwork:   "comcast-sanfrancisco",
			StateID:      "CA",
		}
	}

	return newAtm
}

func generateBackendSystem() BackendSystem {
	i := getRandomNumber(1, 3)

	newBackend := BackendSystem{
		ProcessName:   "accounts",
		Version:       "v2.5",
		OSType:        "lnx",
		OSVersion:     "4.16.10-300.fc28.x86_64",
		CloudProvider: "amzn",
		CloudRegion:   "us-east-2",
	}

	switch i {
	case 1:
		newBackend.Endpoint = "api/v2.5/balance"
	case 2:
		newBackend.Endpoint = "api/v2.5/deposit"
	case 3:
		newBackend.Endpoint = "api/v2.5/withdrawn"
	}

	return newBackend
}

func getRandomNumber(min int, max int) int {
	i := (rand.Intn(max-min+1) + min)
	return i
}

func generateTraces(numberOfTraces int) ptrace.Traces {
	traces := ptrace.NewTraces()

	for i := 0; i < numberOfTraces; i++ {
		newAtm := generateAtm()
		newBackendSystem := generateBackendSystem()

		resourceSpan := traces.ResourceSpans().AppendEmpty()
		atmResource := resourceSpan.Resource()
		fillResourceWithAtm(&atmResource, newAtm)

		resourceSpan = traces.ResourceSpans().AppendEmpty()
		backendResource := resourceSpan.Resource()
		fillResourceWithBackendSystem(&backendResource, newBackendSystem)
	}

	return traces
}

func fillResourceWithAtm(resource *pcommon.Resource, atm Atm) {
	atmAttrs := resource.Attributes()
	atmAttrs.PutInt("atm.id", atm.ID)
	atmAttrs.PutStr("atm.stateid", atm.StateID)
	atmAttrs.PutStr("atm.ispnetwork", atm.ISPNetwork)
	atmAttrs.PutStr("atm.serialnumber", atm.SerialNumber)
	atmAttrs.PutStr(string(semconv.ServiceNameKey), atm.Name)
	atmAttrs.PutStr(string(semconv.ServiceVersionKey), atm.Version)

}

func fillResourceWithBackendSystem(resource *pcommon.Resource, backend BackendSystem) {
	backendAttrs := resource.Attributes()
	var osType, cloudProvider string

	switch {
	case backend.CloudProvider == "amzn":
		cloudProvider = semconv.CloudProviderAWS.Value.AsString()
	case backend.CloudProvider == "mcrsft":
		cloudProvider = semconv.CloudProviderAzure.Value.AsString()
	case backend.CloudProvider == "gogl":
		cloudProvider = semconv.CloudProviderGCP.Value.AsString()
	}

	backendAttrs.PutStr(string(semconv.CloudProviderKey), cloudProvider)
	backendAttrs.PutStr(string(semconv.CloudRegionKey), backend.CloudRegion)

	switch {
	case backend.OSType == "lnx":
		osType = semconv.OSTypeLinux.Value.AsString()
	case backend.OSType == "wndws":
		osType = semconv.OSTypeWindows.Value.AsString()
	case backend.OSType == "slrs":
		osType = semconv.OSTypeSolaris.Value.AsString()
	}

	backendAttrs.PutStr(string(semconv.OSTypeKey), osType)
	backendAttrs.PutStr(string(semconv.OSVersionKey), backend.OSVersion)

	backendAttrs.PutStr(string(semconv.ServiceNameKey), backend.ProcessName)
	backendAttrs.PutStr(string(semconv.ServiceVersionKey), backend.Version)
}
- Updated the
fillResourceWithAtm()function by adding lines to properly assign the “service.name” and “service.version” attributes to thepcommon.Resourcethat represents theAtmentity. - Updated the
fillResourceWithBackendSystem()function by adding lines to properly assign the “service.name” and “service.version” attributes to thepcommon.Resourcethat represents theBackendSystementity. - Updated the
generateTracesfunction by adding lines to properly instantiate apcommon.Resourceand fill in the attribute information for bothAtmandBackendSystementities using thefillResourceWithAtm()andfillResourceWithBackendSystem()functions.
Representing operations with spans
You now have a ResourceSpan instance with the respective Resource properly
filled with attributes to represent the Atm and BackendSystem entities. You
are now ready to represent the operations that each Resource executes as part
of a trace in the ResourceSpan.
In the OTel world, for a system to generate telemetry, it needs to be instrumented either manually or automatically via an instrumentation library.
The instrumentation libraries are responsible for setting the scope (also known as the instrumentation scope), within which the operations participating in a trace occur, and describing these operations as spans in the context of the trace.
pdata.ResourceSpans has a method named ScopeSpans() which returns an
instance of a helper type called ptrace.ScopeSpansSlice. The
ptrace.ScopeSpansSlice type has methods to help you handle the array of
ptrace.ScopeSpans. The array will contain as many items as the number of
ptrace.ScopeSpan representing the different instrumentation scopes and the
spans it generated within the context of a trace.
ptrace.ScopeSpansSlice has a method named AppendEmpty() that adds a new
ptrace.ScopeSpans to the array and return its reference.
Let’s create a function to instantiate a ptrace.ScopeSpans representing the
ATM system’s instrumentation scope and its spans. Open the tailtracer/model.go
file and add the following function:
func appendAtmSystemInstrScopeSpans(resourceSpans *ptrace.ResourceSpans) ptrace.ScopeSpans {
	scopeSpans := resourceSpans.ScopeSpans().AppendEmpty()

	return scopeSpans
}
The ptrace.ScopeSpans has a method named Scope() that returns a reference to
the pcommon.InstrumentationScope instance representing the instrumentation
scope that generated the spans.
pcommon.InstrumentationScope has the following methods to describe an
instrumentation scope:
SetName(v string)sets the name for the instrumentation library.SetVersion(v string)sets the version for the instrumentation library.Name() stringreturns the name associated with the instrumentation library.Version() stringreturns the version associated with the instrumentation library.
Let’s update the appendAtmSystemInstrScopeSpans function so we can set the
name and version of the instrumentation scope for the new ptrace.ScopeSpans.
Here is what appendAtmSystemInstrScopeSpans looks like after the update:
func appendAtmSystemInstrScopeSpans(resourceSpans *ptrace.ResourceSpans) ptrace.ScopeSpans {
	scopeSpans := resourceSpans.ScopeSpans().AppendEmpty()
	scopeSpans.Scope().SetName("atm-system")
	scopeSpans.Scope().SetVersion("v1.0")
	return scopeSpans
}
You can now update the generateTraces function and add variables to represent
the instrumentation scope used by both Atm and BackendSystem entities by
initializing them with the appendAtmSystemInstrScopeSpans(). Here is what
generateTraces() looks like after the update:
func generateTraces(numberOfTraces int) ptrace.Traces{
	traces := ptrace.NewTraces()

	for i := 0; i < numberOfTraces; i++{
		newAtm := generateAtm()
		newBackendSystem := generateBackendSystem()

		resourceSpan := traces.ResourceSpans().AppendEmpty()
		atmResource := resourceSpan.Resource()
		fillResourceWithAtm(&atmResource, newAtm)

		atmInstScope := appendAtmSystemInstrScopeSpans(&resourceSpan)

		resourceSpan = traces.ResourceSpans().AppendEmpty()
		backendResource := resourceSpan.Resource()
		fillResourceWithBackendSystem(&backendResource, newBackendSystem)

		backendInstScope := appendAtmSystemInstrScopeSpans(&resourceSpan)
	}

	return traces
}
At this point, you have everything needed to represent the telemetry generation entities in your system, as well as the instrumentation scope responsible for identifying operations and generating the traces for the system. The next step is to create the spans representing the operations that the given instrumentation scope generated as part of a trace.
ptrace.ScopeSpans has a method named Spans() which returns an instance of a
helper type called ptrace.SpanSlice. The ptrace.SpanSlice type has methods
to help you handle the array of ptrace.Span. The array will contain as many
items as the number of operations the instrumentation scope was able to identify
and describe as part of the trace.
ptrace.SpanSlice has a method named AppendEmpty() that adds a new
ptrace.Span to the array and return its reference.
ptrace.Span has the following methods to describe an operation:
SetTraceID(v pcommon.TraceID)sets thepcommon.TraceIDuniquely identifying the trace that this span is associated with.SetSpanID(v pcommon.SpanID)sets thepcommon.SpanIDuniquely identifying this span in the context of the trace it is associated with.SetParentSpanID(v pcommon.SpanID)setspcommon.SpanIDfor the parent span/operation in case the operation represented by this span is executed as part of the parent (nested).SetName(v string)sets the name of the operation for the spanSetKind(v ptrace.SpanKind)setsptrace.SpanKinddefining the kind of operation the span represents.SetStartTimestamp(v pcommon.Timestamp)sets thepcommon.Timestamprepresenting the date and time when the operation associated with the span has started.SetEndTimestamp(v pcommon.Timestamp)sets thepcommon.Timestamprepresenting the date and time when the operation associated with the span has ended.
As you can see from the methods above, a ptrace.Span is uniquely identified by
2 required IDs; their own unique ID represented by the pcommon.SpanID type and
the ID of the trace they are associated with, represented by a pcommon.TraceID
type.
The pcommon.TraceID has to carry a globally unique ID represented as a 16-byte
array, and should follow the
W3C Trace Context specification.
The pcommon.SpanID is a unique ID in the context of the trace they are
associated with and is represented as an 8-byte array.
The pcommon package provides the following types for generating span IDs:
type TraceID [16]bytetype SpanID [8]byte
For this tutorial, you will create the IDs using functions from the
github.com/google/uuid package for the pcommon.TraceID, and functions from
the crypto/rand package to randomly generate the pcommon.SpanID. First, open
the tailtracer/model.go file and add both packages to the import statement.
After that, add the following functions to help generate both IDs:
import (
	crand "crypto/rand"
	"math/rand"
  	...
)

func NewTraceID() pcommon.TraceID {
	return pcommon.TraceID(uuid.New())
}

func NewSpanID() pcommon.SpanID {
	var rngSeed int64
	_ = binary.Read(crand.Reader, binary.LittleEndian, &rngSeed)
	randSource := rand.New(rand.NewSource(rngSeed))

	var sid [8]byte
	randSource.Read(sid[:])
	spanID := pcommon.SpanID(sid)

	return spanID
}
- Imported
crypto/randascrand, to avoid conflicts withmath/rand. - Added new functions
NewTraceID()andNewSpanID(), to generate trace ID and span ID, respectively.
Now that you have a way to identify the spans properly, you can start creating them to represent the operations both within and across the entities in your system.
As part of the generateBackendSystem() function, we have randomly assigned the
operations that the BackEndSystem entity can provide as services to the
system. Next, we will open the tailtracer/model.go file and look at the
function named appendTraceSpans(), which will be responsible for creating a
trace and appending spans that represent the BackendSystem operations. Here is
what the initial implementation for the appendTraceSpans() function looks
like:
func appendTraceSpans(backend *BackendSystem, backendScopeSpans *ptrace.ScopeSpans, atmScopeSpans *ptrace.ScopeSpans) {
	traceId := NewTraceID()
	backendSpanId := NewSpanID()

	backendDuration, _ := time.ParseDuration("1s")
	backendSpanStartTime := time.Now()
	backendSpanFinishTime := backendSpanStartTime.Add(backendDuration)

	backendSpan := backendScopeSpans.Spans().AppendEmpty()
	backendSpan.SetTraceID(traceId)
	backendSpan.SetSpanID(backendSpanId)
	backendSpan.SetName(backend.Endpoint)
	backendSpan.SetKind(ptrace.SpanKindServer)
	backendSpan.SetStartTimestamp(pcommon.NewTimestampFromTime(backendSpanStartTime))
	backendSpan.SetEndTimestamp(pcommon.NewTimestampFromTime(backendSpanFinishTime))
}
- Added
traceIdandbackendSpanIdvariables to represent the trace and the span ID, respectively, and initialized them with the helper functions created previously. - Added
backendSpanStartTimeandbackendSpanFinishTimeto represent the start and the end time of the operation. For the tutorial, anyBackendSystemoperation will take 1 second. - Added a variable named
backendSpanwhich will hold the instance of theptrace.Spanrepresenting this operation. - Set the
Nameof the span with theEndpointfield value from theBackendSysteminstance. - Set the
Kindof the span toptrace.SpanKindServer. Refer to the SpanKind section in the trace specification to understand how to define SpanKind properly. - Used all the methods mentioned above to fill the
ptrace.Spanwith the proper values to represent theBackendSystemoperation.
You may have noticed that there are 2 references to ptrace.ScopeSpans as
parameters in the appendTraceSpans() function, but we only used one of them.
Don’t worry about it for now; we will get back to it later.
Next, you will update the generateTraces() function so that it can generate
the trace by calling the appendTraceSpans() function. Here is what the updated
generateTraces() function looks like:
func generateTraces(numberOfTraces int) ptrace.Traces {
	traces := ptrace.NewTraces()

	for i := 0; i < numberOfTraces; i++ {
		newAtm := generateAtm()
		newBackendSystem := generateBackendSystem()

		resourceSpan := traces.ResourceSpans().AppendEmpty()
		atmResource := resourceSpan.Resource()
		fillResourceWithAtm(&atmResource, newAtm)

		atmInstScope := appendAtmSystemInstrScopeSpans(&resourceSpan)

		resourceSpan = traces.ResourceSpans().AppendEmpty()
		backendResource := resourceSpan.Resource()
		fillResourceWithBackendSystem(&backendResource, newBackendSystem)

		backendInstScope := appendAtmSystemInstrScopeSpans(&resourceSpan)

		appendTraceSpans(&newBackendSystem, &backendInstScope, &atmInstScope)
	}

	return traces
}
You now have the BackendSystem entity and its operations represented in spans
in a proper trace context! Next, you need to push the generated trace through
the pipeline so that the next consumer, either a processor or an exporter, can
receive and process it.
Here is how the tailtracer/model.go file looks:
tailtracer/model.go
package tailtracer

import (
	crand "crypto/rand"
	"encoding/binary"
	"math/rand"
	"time"

	"github.com/google/uuid"
	"go.opentelemetry.io/collector/pdata/pcommon"
	"go.opentelemetry.io/collector/pdata/ptrace"
	"go.opentelemetry.io/otel/semconv/v1.38.0"
)

type Atm struct {
	ID           int64
	Version      string
	Name         string
	StateID      string
	SerialNumber string
	ISPNetwork   string
}

type BackendSystem struct {
	Version       string
	ProcessName   string
	OSType        string
	OSVersion     string
	CloudProvider string
	CloudRegion   string
	Endpoint      string
}

func generateAtm() Atm {
	i := getRandomNumber(1, 2)
	var newAtm Atm

	switch i {
	case 1:
		newAtm = Atm{
			ID:           111,
			Name:         "ATM-111-IL",
			SerialNumber: "atmxph-2022-111",
			Version:      "v1.0",
			ISPNetwork:   "comcast-chicago",
			StateID:      "IL",
		}

	case 2:
		newAtm = Atm{
			ID:           222,
			Name:         "ATM-222-CA",
			SerialNumber: "atmxph-2022-222",
			Version:      "v1.0",
			ISPNetwork:   "comcast-sanfrancisco",
			StateID:      "CA",
		}
	}

	return newAtm
}

func generateBackendSystem() BackendSystem {
	i := getRandomNumber(1, 3)

	newBackend := BackendSystem{
		ProcessName:   "accounts",
		Version:       "v2.5",
		OSType:        "lnx",
		OSVersion:     "4.16.10-300.fc28.x86_64",
		CloudProvider: "amzn",
		CloudRegion:   "us-east-2",
	}

	switch i {
	case 1:
		newBackend.Endpoint = "api/v2.5/balance"
	case 2:
		newBackend.Endpoint = "api/v2.5/deposit"
	case 3:
		newBackend.Endpoint = "api/v2.5/withdrawn"
	}

	return newBackend
}

func getRandomNumber(min int, max int) int {
	i := (rand.Intn(max-min+1) + min)
	return i
}

func generateTraces(numberOfTraces int) ptrace.Traces {
	traces := ptrace.NewTraces()

	for i := 0; i < numberOfTraces; i++ {
		newAtm := generateAtm()
		newBackendSystem := generateBackendSystem()

		resourceSpan := traces.ResourceSpans().AppendEmpty()
		atmResource := resourceSpan.Resource()
		fillResourceWithAtm(&atmResource, newAtm)

		atmInstScope := appendAtmSystemInstrScopeSpans(&resourceSpan)

		resourceSpan = traces.ResourceSpans().AppendEmpty()
		backendResource := resourceSpan.Resource()
		fillResourceWithBackendSystem(&backendResource, newBackendSystem)

		backendInstScope := appendAtmSystemInstrScopeSpans(&resourceSpan)

		appendTraceSpans(&newBackendSystem, &backendInstScope, &atmInstScope)
	}

	return traces
}

func fillResourceWithAtm(resource *pcommon.Resource, atm Atm) {
	atmAttrs := resource.Attributes()
	atmAttrs.PutInt("atm.id", atm.ID)
	atmAttrs.PutStr("atm.stateid", atm.StateID)
	atmAttrs.PutStr("atm.ispnetwork", atm.ISPNetwork)
	atmAttrs.PutStr("atm.serialnumber", atm.SerialNumber)
	atmAttrs.PutStr(string(semconv.ServiceNameKey), atm.Name)
	atmAttrs.PutStr(string(semconv.ServiceVersionKey), atm.Version)

}

func fillResourceWithBackendSystem(resource *pcommon.Resource, backend BackendSystem) {
	backendAttrs := resource.Attributes()
	var osType, cloudProvider string

	switch {
	case backend.CloudProvider == "amzn":
		cloudProvider = semconv.CloudProviderAWS.Value.AsString()
	case backend.CloudProvider == "mcrsft":
		cloudProvider = semconv.CloudProviderAzure.Value.AsString()
	case backend.CloudProvider == "gogl":
		cloudProvider = semconv.CloudProviderGCP.Value.AsString()
	}

	backendAttrs.PutStr(string(semconv.CloudProviderKey), cloudProvider)
	backendAttrs.PutStr(string(semconv.CloudRegionKey), backend.CloudRegion)

	switch {
	case backend.OSType == "lnx":
		osType = semconv.OSTypeLinux.Value.AsString()
	case backend.OSType == "wndws":
		osType = semconv.OSTypeWindows.Value.AsString()
	case backend.OSType == "slrs":
		osType = semconv.OSTypeSolaris.Value.AsString()
	}

	backendAttrs.PutStr(string(semconv.OSTypeKey), osType)
	backendAttrs.PutStr(string(semconv.OSVersionKey), backend.OSVersion)

	backendAttrs.PutStr(string(semconv.ServiceNameKey), backend.ProcessName)
	backendAttrs.PutStr(string(semconv.ServiceVersionKey), backend.Version)
}

func appendAtmSystemInstrScopeSpans(resourceSpans *ptrace.ResourceSpans) ptrace.ScopeSpans {
	scopeSpans := resourceSpans.ScopeSpans().AppendEmpty()
	scopeSpans.Scope().SetName("atm-system")
	scopeSpans.Scope().SetVersion("v1.0")
	return scopeSpans
}

func NewTraceID() pcommon.TraceID {
	return pcommon.TraceID(uuid.New())
}

func NewSpanID() pcommon.SpanID {
	var rngSeed int64
	_ = binary.Read(crand.Reader, binary.LittleEndian, &rngSeed)
	randSource := rand.New(rand.NewSource(rngSeed))

	var sid [8]byte
	randSource.Read(sid[:])
	spanID := pcommon.SpanID(sid)

	return spanID
}

func appendTraceSpans(backend *BackendSystem, backendScopeSpans *ptrace.ScopeSpans, atmScopeSpans *ptrace.ScopeSpans) {
	traceId := NewTraceID()
	backendSpanId := NewSpanID()

	backendDuration, _ := time.ParseDuration("1s")
	backendSpanStartTime := time.Now()
	backendSpanFinishTime := backendSpanStartTime.Add(backendDuration)

	backendSpan := backendScopeSpans.Spans().AppendEmpty()
	backendSpan.SetTraceID(traceId)
	backendSpan.SetSpanID(backendSpanId)
	backendSpan.SetName(backend.Endpoint)
	backendSpan.SetKind(ptrace.SpanKindServer)
	backendSpan.SetStartTimestamp(pcommon.NewTimestampFromTime(backendSpanStartTime))
	backendSpan.SetEndTimestamp(pcommon.NewTimestampFromTime(backendSpanFinishTime))
}
The consumer.Traces has a method called ConsumeTraces(), which is
responsible for pushing the generated traces to the next consumer in the
pipeline. You need to update the Start() method in the tailtracerReceiver
type and add the code to use it.
Open the tailtracer/trace-receiver.go file and update the Start() method as
follows:
func (tailtracerRcvr *tailtracerReceiver) Start(ctx context.Context, host component.Host) error {
	tailtracerRcvr.host = host
	ctx = context.Background()
	ctx, tailtracerRcvr.cancel = context.WithCancel(ctx)

	interval, _ := time.ParseDuration(tailtracerRcvr.config.Interval)
	go func() {
		ticker := time.NewTicker(interval)
		defer ticker.Stop()
		for {
			select {
				case <-ticker.C:
					tailtracerRcvr.logger.Info("I should start processing traces now!")
					tailtracerRcvr.nextConsumer.ConsumeTraces(ctx, generateTraces(tailtracerRcvr.config.NumberOfTraces)) // new line added
				case <-ctx.Done():
					return
			}
		}
	}()

	return nil
}
- Added a line under the
case <=ticker.Ccondition calling thetailtracerRcvr.nextConsumer.ConsumeTraces()method, passing the new context created in theStart()method (ctx), and a call to thegenerateTraces()function so the generated traces can be pushed to the next consumer in the pipeline.
Now let’s run the otelcol-dev again:
go run ./otelcol-dev --config config.yaml
You should see the output like this after a few minutes:
2023-11-09T11:38:19.890+0800	info	service@v0.88.0/telemetry.go:84	Setting up own telemetry...
2023-11-09T11:38:19.890+0800	info	service@v0.88.0/telemetry.go:201	Serving Prometheus metrics	{"address": ":8888", "level": "Basic"}
2023-11-09T11:38:19.890+0800	debug	exporter@v0.88.0/exporter.go:273	Stable component.	{"kind": "exporter", "data_type": "traces", "name": "otlp/jaeger"}
2023-11-09T11:38:19.890+0800	info	exporter@v0.88.0/exporter.go:275	Development component. May change in the future.	{"kind": "exporter", "data_type": "traces", "name": "debug"}
2023-11-09T11:38:19.891+0800	debug	receiver@v0.88.0/receiver.go:294	Stable component.	{"kind": "receiver", "name": "otlp", "data_type": "traces"}
2023-11-09T11:38:19.891+0800	debug	receiver@v0.88.0/receiver.go:294	Alpha component. May change in the future.	{"kind": "receiver", "name": "tailtracer", "data_type": "traces"}
2023-11-09T11:38:19.891+0800	info	service@v0.88.0/service.go:143	Starting otelcol-dev...	{"Version": "1.0.0", "NumCPU": 10}
2023-11-09T11:38:19.891+0800	info	extensions/extensions.go:33	Starting extensions...

<OMITTED>

2023-11-09T11:38:19.903+0800	info	zapgrpc/zapgrpc.go:178	[core] [Channel #1] Channel Connectivity change to READY	{"grpc_log": true}
2023-11-09T11:39:19.894+0800	info	tailtracer/trace-receiver.go:33	I should start processing traces now!	{"kind": "receiver", "name": "tailtracer", "data_type": "traces"}
2023-11-09T11:39:19.913+0800	info	TracesExporter	{"kind": "exporter", "data_type": "traces", "name": "debug", "resource spans": 4, "spans": 2}
2023-11-09T11:39:19.913+0800	info	ResourceSpans #0
Resource SchemaURL:
Resource attributes:
     -> atm.id: Int(222)
     -> atm.stateid: Str(CA)
     -> atm.ispnetwork: Str(comcast-sanfrancisco)
     -> atm.serialnumber: Str(atmxph-2022-222)
     -> service.name: Str(ATM-222-CA)
     -> service.version: Str(v1.0)
ScopeSpans #0
ScopeSpans SchemaURL:
InstrumentationScope
ResourceSpans #1
Resource SchemaURL:
Resource attributes:
     -> cloud.provider: Str(aws)
     -> cloud.region: Str(us-east-2)
     -> os.type: Str(linux)
     -> os.version: Str(4.16.10-300.fc28.x86_64)
     -> service.name: Str(accounts)
     -> service.version: Str(v2.5)
ScopeSpans #0
ScopeSpans SchemaURL:
InstrumentationScope
Span #0
    Trace ID       : bbcb00aead044a138cf96c0bf4a4ba83
    Parent ID      :
    ID             : 5056fe4e9adf621c
    Name           : api/v2.5/withdrawn
    Kind           : Server
    Start time     : 2023-11-09 03:39:19.894881 +0000 UTC
    End time       : 2023-11-09 03:39:20.894881 +0000 UTC
    Status code    : Unset
    Status message :
ResourceSpans #2
Resource SchemaURL:
Resource attributes:
     -> atm.id: Int(111)
     -> atm.stateid: Str(IL)
     -> atm.ispnetwork: Str(comcast-chicago)
     -> atm.serialnumber: Str(atmxph-2022-111)
     -> service.name: Str(ATM-111-IL)
     -> service.version: Str(v1.0)
ScopeSpans #0
ScopeSpans SchemaURL:
InstrumentationScope
ResourceSpans #3
Resource SchemaURL:
Resource attributes:
     -> cloud.provider: Str(aws)
     -> cloud.region: Str(us-east-2)
     -> os.type: Str(linux)
     -> os.version: Str(4.16.10-300.fc28.x86_64)
     -> service.name: Str(accounts)
     -> service.version: Str(v2.5)
ScopeSpans #0
ScopeSpans SchemaURL:
InstrumentationScope
Span #0
    Trace ID       : ba013b8223ec4d29806ae493ecd1a5e4
    Parent ID      :
    ID             : 4feb47b55c9c4129
    Name           : api/v2.5/withdrawn
    Kind           : Server
    Start time     : 2023-11-09 03:39:19.894953 +0000 UTC
    End time       : 2023-11-09 03:39:20.894953 +0000 UTC
    Status code    : Unset
    Status message :
	{"kind": "exporter", "data_type": "traces", "name": "debug"}
...
Here is what the generated trace looks like in Jaeger:
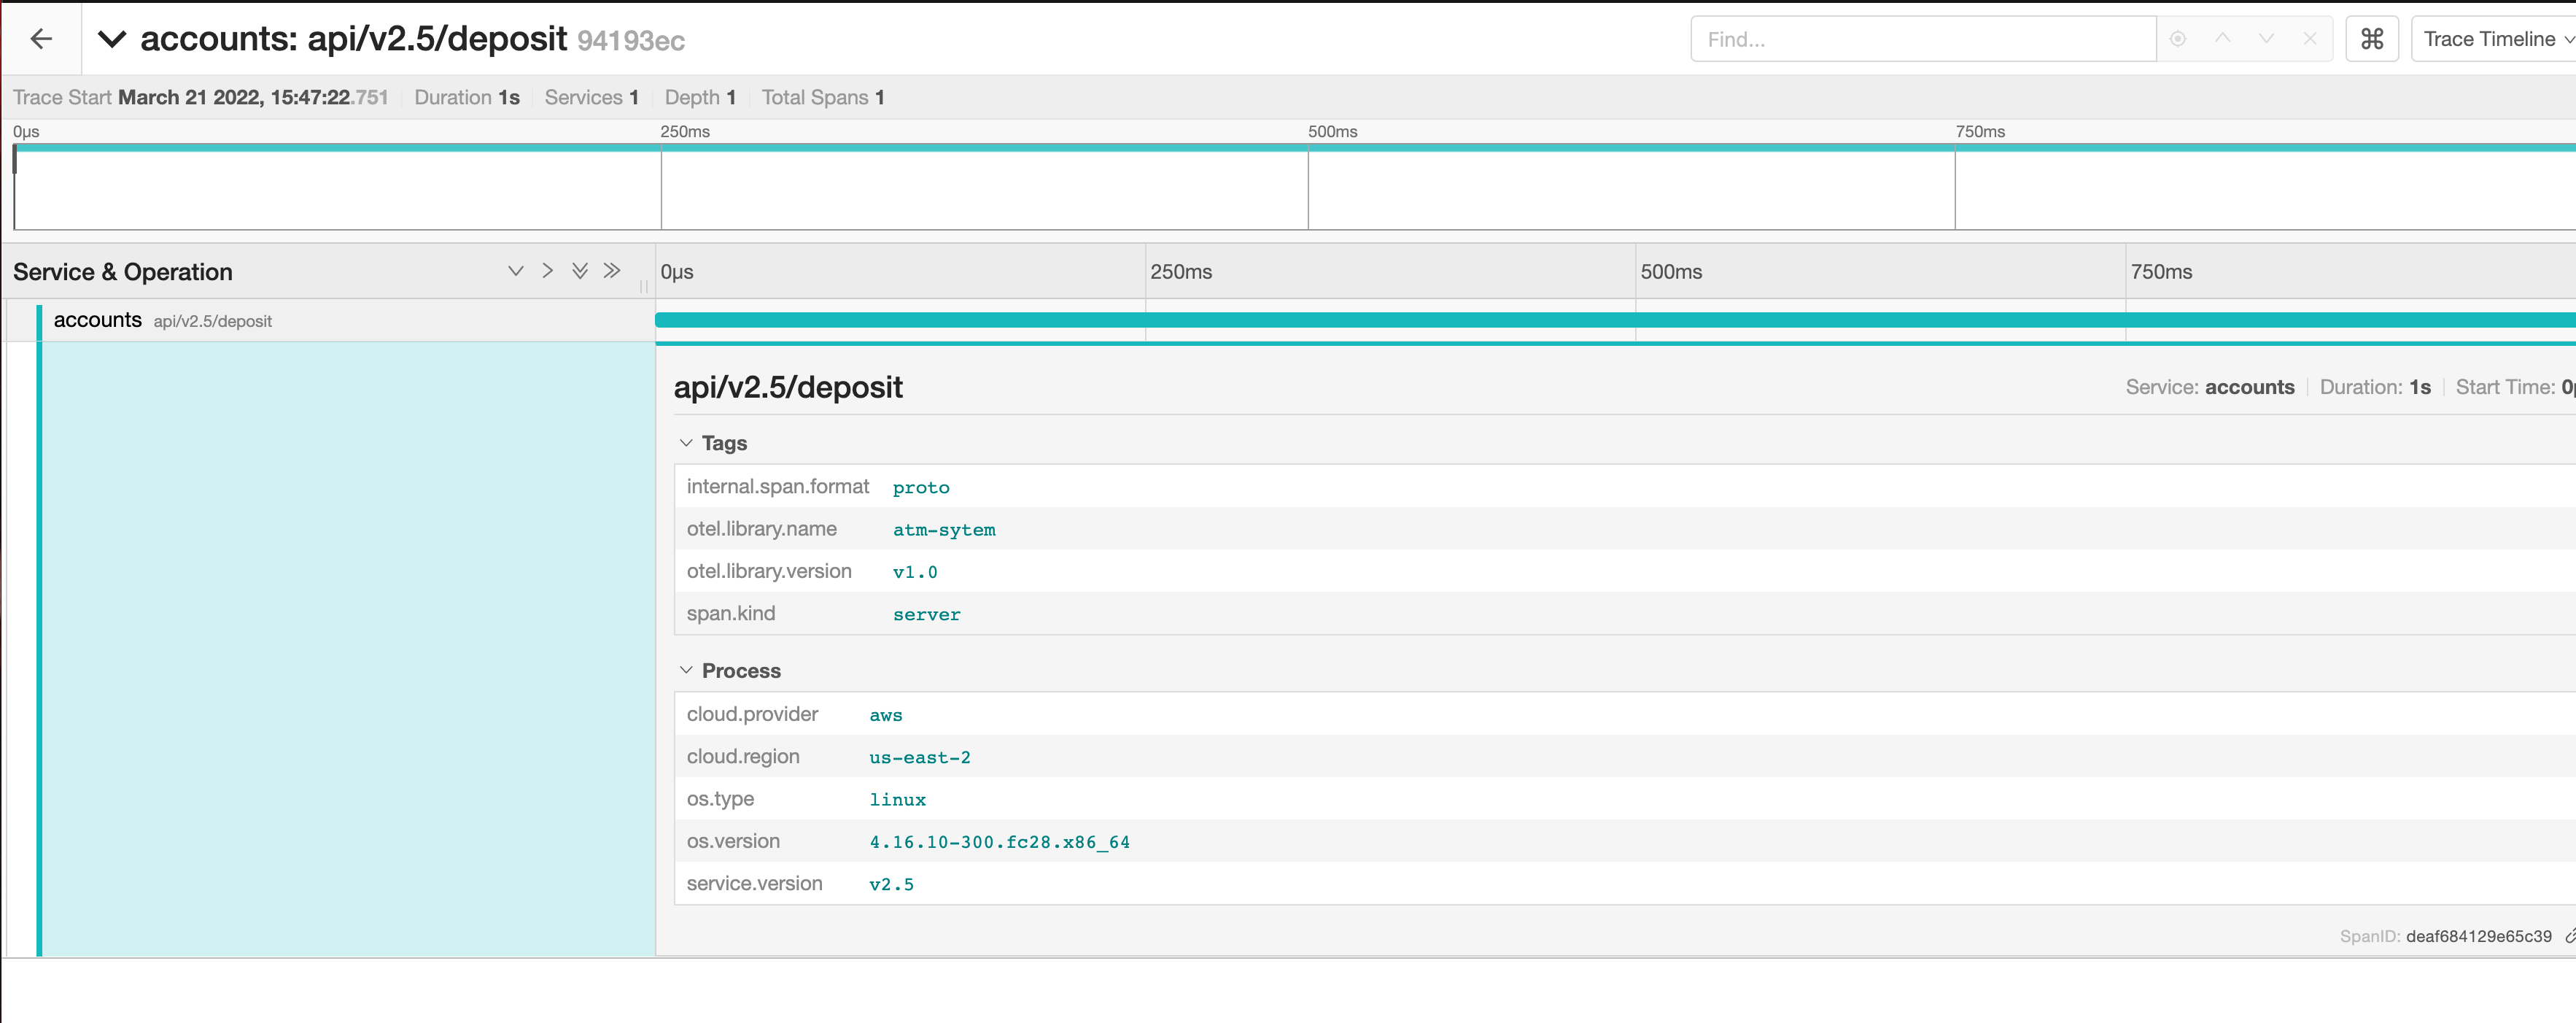
What you currently see in Jaeger represents a service that is receiving a
request from an external entity that is not instrumented by an OTel SDK. As a
result, it cannot be identified as the origin/start of the trace. For a
ptrace.Span to understand that it is representing an operation that was
executed as a result of another operation that originated either within or
outside (nested/child) the Resource in the same trace context, you will need
to:
- Set the same trace context as the caller operation by calling the
SetTraceID()method and passing thepcommon.TraceIDof the parent/callerptrace.Spanas a parameter. - Define the caller operation in the context of the trace by calling the
SetParentId()method and passing thepcommon.SpanIDof the parent/callerptrace.Spanas a parameter.
You will now create a ptrace.Span that represents the Atm entity operations
and set it as the parent for the BackendSystem span. Open the
tailtracer/model.go file and update the appendTraceSpans() function as
follows:
func appendTraceSpans(backend *BackendSystem, backendScopeSpans *ptrace.ScopeSpans, atmScopeSpans *ptrace.ScopeSpans) {
	traceId := NewTraceID()

	var atmOperationName string

	switch {
		case strings.Contains(backend.Endpoint, "balance"):
			atmOperationName = "Check Balance"
		case strings.Contains(backend.Endpoint, "deposit"):
			atmOperationName = "Make Deposit"
		case strings.Contains(backend.Endpoint, "withdraw"):
			atmOperationName = "Fast Cash"
		}

	atmSpanId := NewSpanID()
	atmSpanStartTime := time.Now()
	atmDuration, _ := time.ParseDuration("4s")
	atmSpanFinishTime := atmSpanStartTime.Add(atmDuration)

	atmSpan := atmScopeSpans.Spans().AppendEmpty()
	atmSpan.SetTraceID(traceId)
	atmSpan.SetSpanID(atmSpanId)
	atmSpan.SetName(atmOperationName)
	atmSpan.SetKind(ptrace.SpanKindClient)
	atmSpan.Status().SetCode(ptrace.StatusCodeOk)
	atmSpan.SetStartTimestamp(pcommon.NewTimestampFromTime(atmSpanStartTime))
	atmSpan.SetEndTimestamp(pcommon.NewTimestampFromTime(atmSpanFinishTime))

	backendSpanId := NewSpanID()

	backendDuration, _ := time.ParseDuration("2s")
	backendSpanStartTime := atmSpanStartTime.Add(backendDuration)

	backendSpan := backendScopeSpans.Spans().AppendEmpty()
	backendSpan.SetTraceID(atmSpan.TraceID())
	backendSpan.SetSpanID(backendSpanId)
	backendSpan.SetParentSpanID(atmSpan.SpanID())
	backendSpan.SetName(backend.Endpoint)
	backendSpan.SetKind(ptrace.SpanKindServer)
	backendSpan.Status().SetCode(ptrace.StatusCodeOk)
	backendSpan.SetStartTimestamp(pcommon.NewTimestampFromTime(backendSpanStartTime))
	backendSpan.SetEndTimestamp(atmSpan.EndTimestamp())
}
Here is what the final tailtracer/model.go file looks like:
tailtracer/model.go
package tailtracer

import (
	crand "crypto/rand"
	"encoding/binary"
	"math/rand"
	"strings"
	"time"

	"github.com/google/uuid"
	"go.opentelemetry.io/collector/pdata/pcommon"
	"go.opentelemetry.io/collector/pdata/ptrace"
	 "go.opentelemetry.io/otel/semconv/v1.38.0"
)

type Atm struct {
	ID           int64
	Version      string
	Name         string
	StateID      string
	SerialNumber string
	ISPNetwork   string
}

type BackendSystem struct {
	Version       string
	ProcessName   string
	OSType        string
	OSVersion     string
	CloudProvider string
	CloudRegion   string
	Endpoint      string
}

func generateAtm() Atm {
	i := getRandomNumber(1, 2)
	var newAtm Atm

	switch i {
	case 1:
		newAtm = Atm{
			ID:           111,
			Name:         "ATM-111-IL",
			SerialNumber: "atmxph-2022-111",
			Version:      "v1.0",
			ISPNetwork:   "comcast-chicago",
			StateID:      "IL",
		}

	case 2:
		newAtm = Atm{
			ID:           222,
			Name:         "ATM-222-CA",
			SerialNumber: "atmxph-2022-222",
			Version:      "v1.0",
			ISPNetwork:   "comcast-sanfrancisco",
			StateID:      "CA",
		}
	}

	return newAtm
}

func generateBackendSystem() BackendSystem {
	i := getRandomNumber(1, 3)

	newBackend := BackendSystem{
		ProcessName:   "accounts",
		Version:       "v2.5",
		OSType:        "lnx",
		OSVersion:     "4.16.10-300.fc28.x86_64",
		CloudProvider: "amzn",
		CloudRegion:   "us-east-2",
	}

	switch i {
	case 1:
		newBackend.Endpoint = "api/v2.5/balance"
	case 2:
		newBackend.Endpoint = "api/v2.5/deposit"
	case 3:
		newBackend.Endpoint = "api/v2.5/withdrawn"
	}

	return newBackend
}

func getRandomNumber(min int, max int) int {
	i := (rand.Intn(max-min+1) + min)
	return i
}

func generateTraces(numberOfTraces int) ptrace.Traces {
	traces := ptrace.NewTraces()

	for i := 0; i < numberOfTraces; i++ {
		newAtm := generateAtm()
		newBackendSystem := generateBackendSystem()

		resourceSpan := traces.ResourceSpans().AppendEmpty()
		atmResource := resourceSpan.Resource()
		fillResourceWithAtm(&atmResource, newAtm)

		atmInstScope := appendAtmSystemInstrScopeSpans(&resourceSpan)

		resourceSpan = traces.ResourceSpans().AppendEmpty()
		backendResource := resourceSpan.Resource()
		fillResourceWithBackendSystem(&backendResource, newBackendSystem)

		backendInstScope := appendAtmSystemInstrScopeSpans(&resourceSpan)

		appendTraceSpans(&newBackendSystem, &backendInstScope, &atmInstScope)
	}

	return traces
}

func fillResourceWithAtm(resource *pcommon.Resource, atm Atm) {
	atmAttrs := resource.Attributes()
	atmAttrs.PutInt("atm.id", atm.ID)
	atmAttrs.PutStr("atm.stateid", atm.StateID)
	atmAttrs.PutStr("atm.ispnetwork", atm.ISPNetwork)
	atmAttrs.PutStr("atm.serialnumber", atm.SerialNumber)
	atmAttrs.PutStr(string(semconv.ServiceNameKey), atm.Name)
	atmAttrs.PutStr(string(semconv.ServiceVersionKey), atm.Version)

}

func fillResourceWithBackendSystem(resource *pcommon.Resource, backend BackendSystem) {
	backendAttrs := resource.Attributes()
	var osType, cloudProvider string

	switch {
	case backend.CloudProvider == "amzn":
		cloudProvider = semconv.CloudProviderAWS.Value.AsString()
	case backend.CloudProvider == "mcrsft":
		cloudProvider = semconv.CloudProviderAzure.Value.AsString()
	case backend.CloudProvider == "gogl":
		cloudProvider = semconv.CloudProviderGCP.Value.AsString()
	}

	backendAttrs.PutStr(string(semconv.CloudProviderKey), cloudProvider)
	backendAttrs.PutStr(string(semconv.CloudRegionKey), backend.CloudRegion)

	switch {
	case backend.OSType == "lnx":
		osType = semconv.OSTypeLinux.Value.AsString()
	case backend.OSType == "wndws":
		osType = semconv.OSTypeWindows.Value.AsString()
	case backend.OSType == "slrs":
		osType = semconv.OSTypeSolaris.Value.AsString()
	}

	backendAttrs.PutStr(string(semconv.OSTypeKey), osType)
	backendAttrs.PutStr(string(semconv.OSVersionKey), backend.OSVersion)

	backendAttrs.PutStr(string(semconv.ServiceNameKey), backend.ProcessName)
	backendAttrs.PutStr(string(semconv.ServiceVersionKey), backend.Version)
}

func appendAtmSystemInstrScopeSpans(resourceSpans *ptrace.ResourceSpans) ptrace.ScopeSpans {
	scopeSpans := resourceSpans.ScopeSpans().AppendEmpty()
	scopeSpans.Scope().SetName("atm-system")
	scopeSpans.Scope().SetVersion("v1.0")
	return scopeSpans
}

func NewTraceID() pcommon.TraceID {
	return pcommon.TraceID(uuid.New())
}

func NewSpanID() pcommon.SpanID {
	var rngSeed int64
	_ = binary.Read(crand.Reader, binary.LittleEndian, &rngSeed)
	randSource := rand.New(rand.NewSource(rngSeed))

	var sid [8]byte
	randSource.Read(sid[:])
	spanID := pcommon.SpanID(sid)

	return spanID
}

func appendTraceSpans(backend *BackendSystem, backendScopeSpans *ptrace.ScopeSpans, atmScopeSpans *ptrace.ScopeSpans) {
	traceId := NewTraceID()

	var atmOperationName string

	switch {
	case strings.Contains(backend.Endpoint, "balance"):
		atmOperationName = "Check Balance"
	case strings.Contains(backend.Endpoint, "deposit"):
		atmOperationName = "Make Deposit"
	case strings.Contains(backend.Endpoint, "withdraw"):
		atmOperationName = "Fast Cash"
	}

	atmSpanId := NewSpanID()
	atmSpanStartTime := time.Now()
	atmDuration, _ := time.ParseDuration("4s")
	atmSpanFinishTime := atmSpanStartTime.Add(atmDuration)

	atmSpan := atmScopeSpans.Spans().AppendEmpty()
	atmSpan.SetTraceID(traceId)
	atmSpan.SetSpanID(atmSpanId)
	atmSpan.SetName(atmOperationName)
	atmSpan.SetKind(ptrace.SpanKindClient)
	atmSpan.Status().SetCode(ptrace.StatusCodeOk)
	atmSpan.SetStartTimestamp(pcommon.NewTimestampFromTime(atmSpanStartTime))
	atmSpan.SetEndTimestamp(pcommon.NewTimestampFromTime(atmSpanFinishTime))

	backendSpanId := NewSpanID()

	backendDuration, _ := time.ParseDuration("2s")
	backendSpanStartTime := atmSpanStartTime.Add(backendDuration)

	backendSpan := backendScopeSpans.Spans().AppendEmpty()
	backendSpan.SetTraceID(atmSpan.TraceID())
	backendSpan.SetSpanID(backendSpanId)
	backendSpan.SetParentSpanID(atmSpan.SpanID())
	backendSpan.SetName(backend.Endpoint)
	backendSpan.SetKind(ptrace.SpanKindServer)
	backendSpan.Status().SetCode(ptrace.StatusCodeOk)
	backendSpan.SetStartTimestamp(pcommon.NewTimestampFromTime(backendSpanStartTime))
	backendSpan.SetEndTimestamp(atmSpan.EndTimestamp())
}
Run the otelcol-dev again:
go run ./otelcol-dev --config config.yaml
After about 2 minutes, you should start seeing traces in Jaeger that look like
the following:
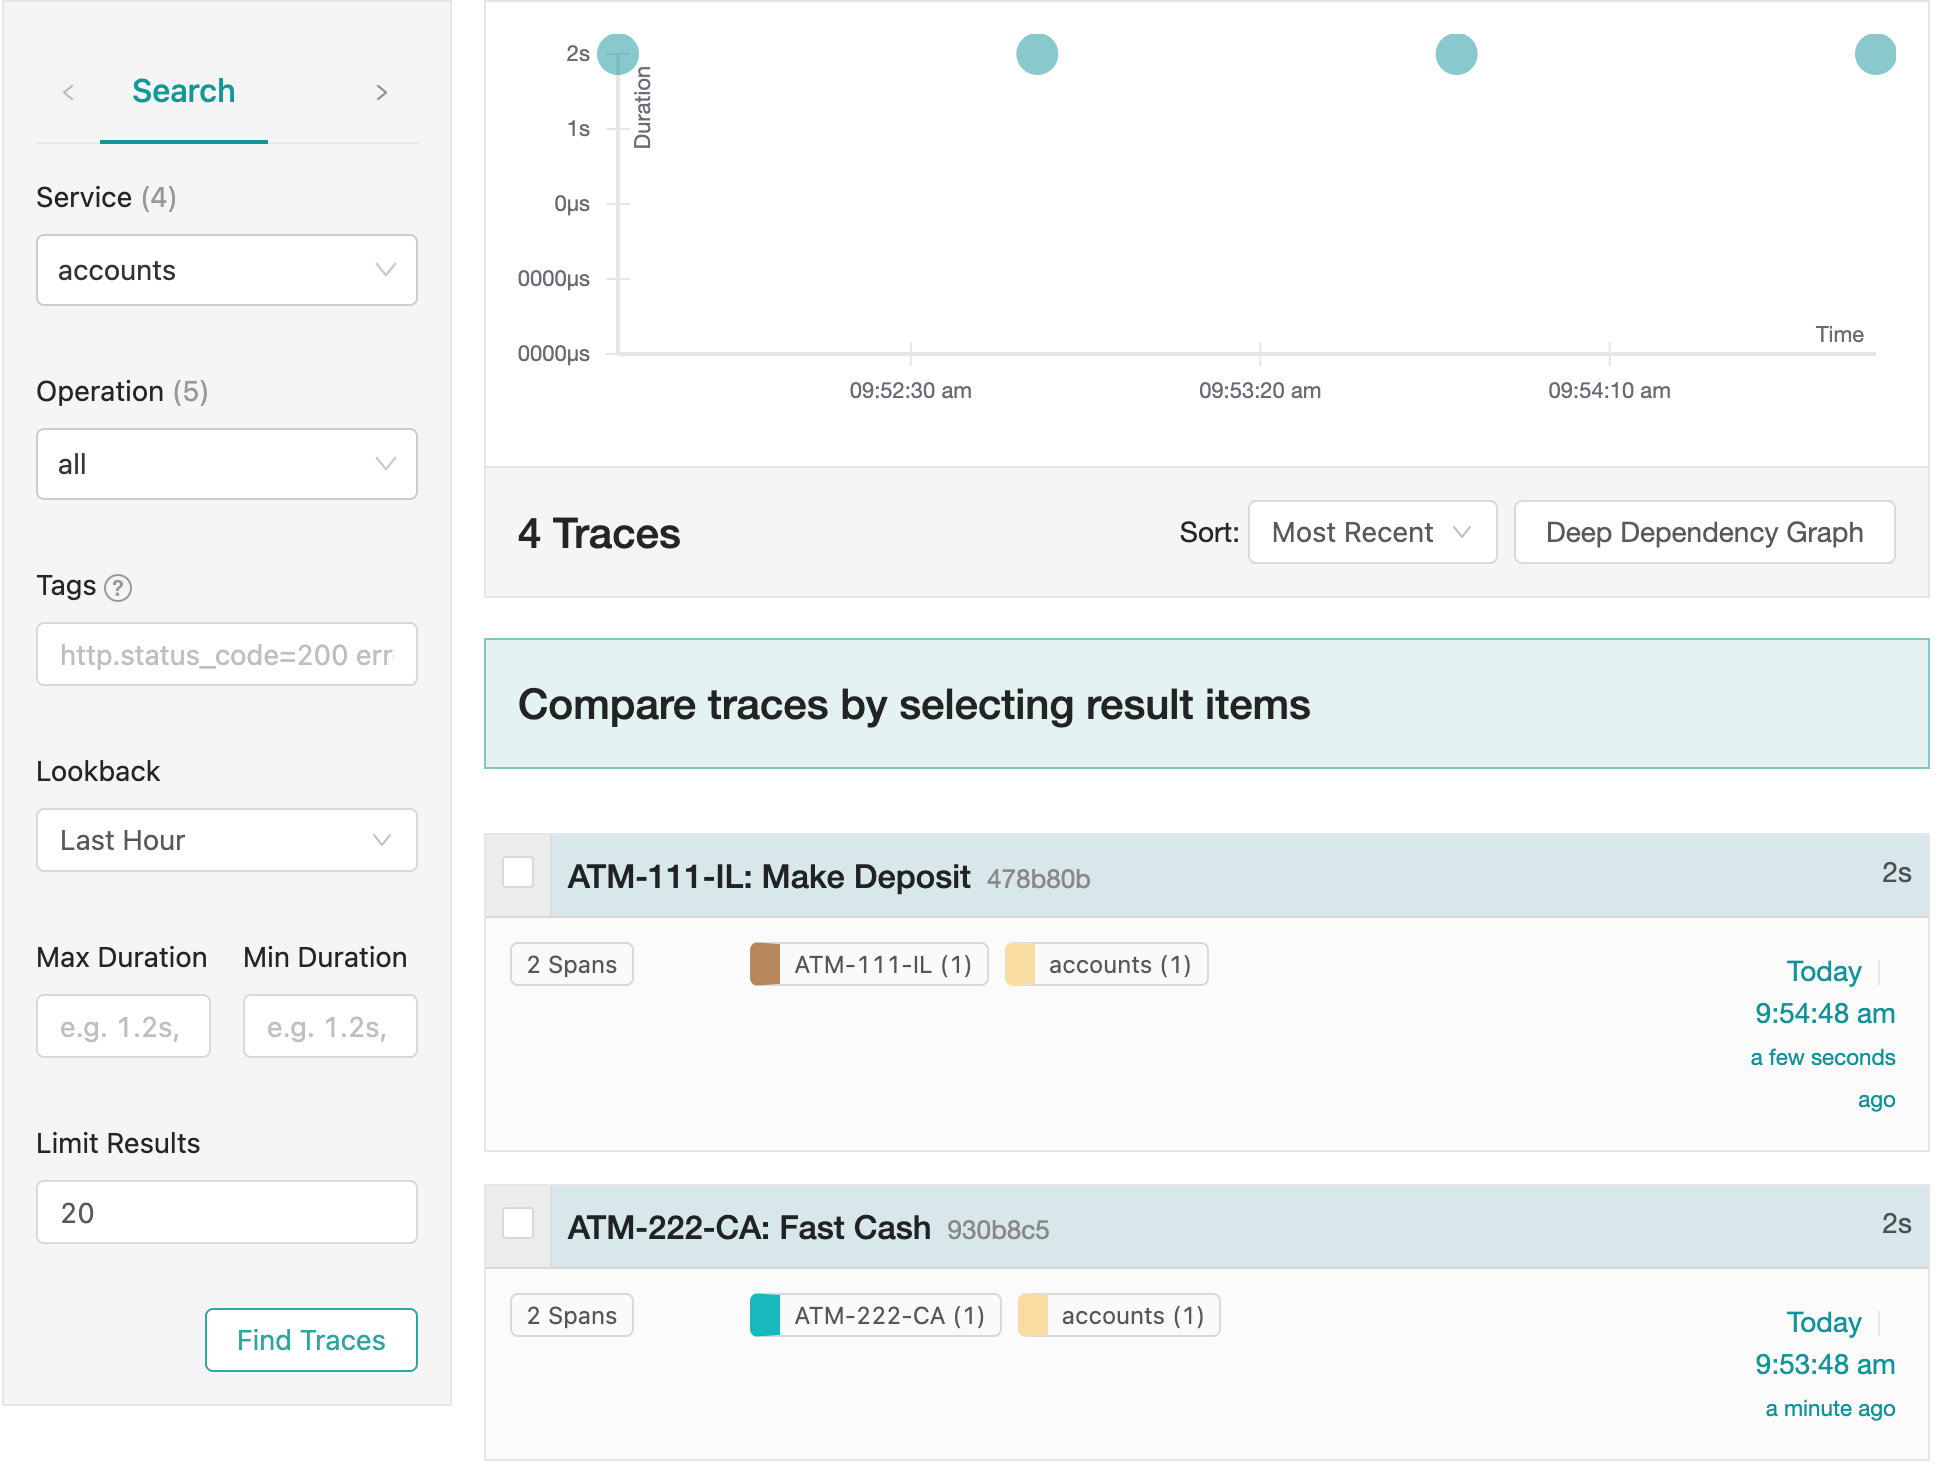
We now have services representing both the Atm and the BackendSystem
telemetry generation entities in our system. We fully understand how both
entities are being used and how they contribute to the performance of an
operation executed by a user.
Here is the detailed view of one of those traces in Jaeger:
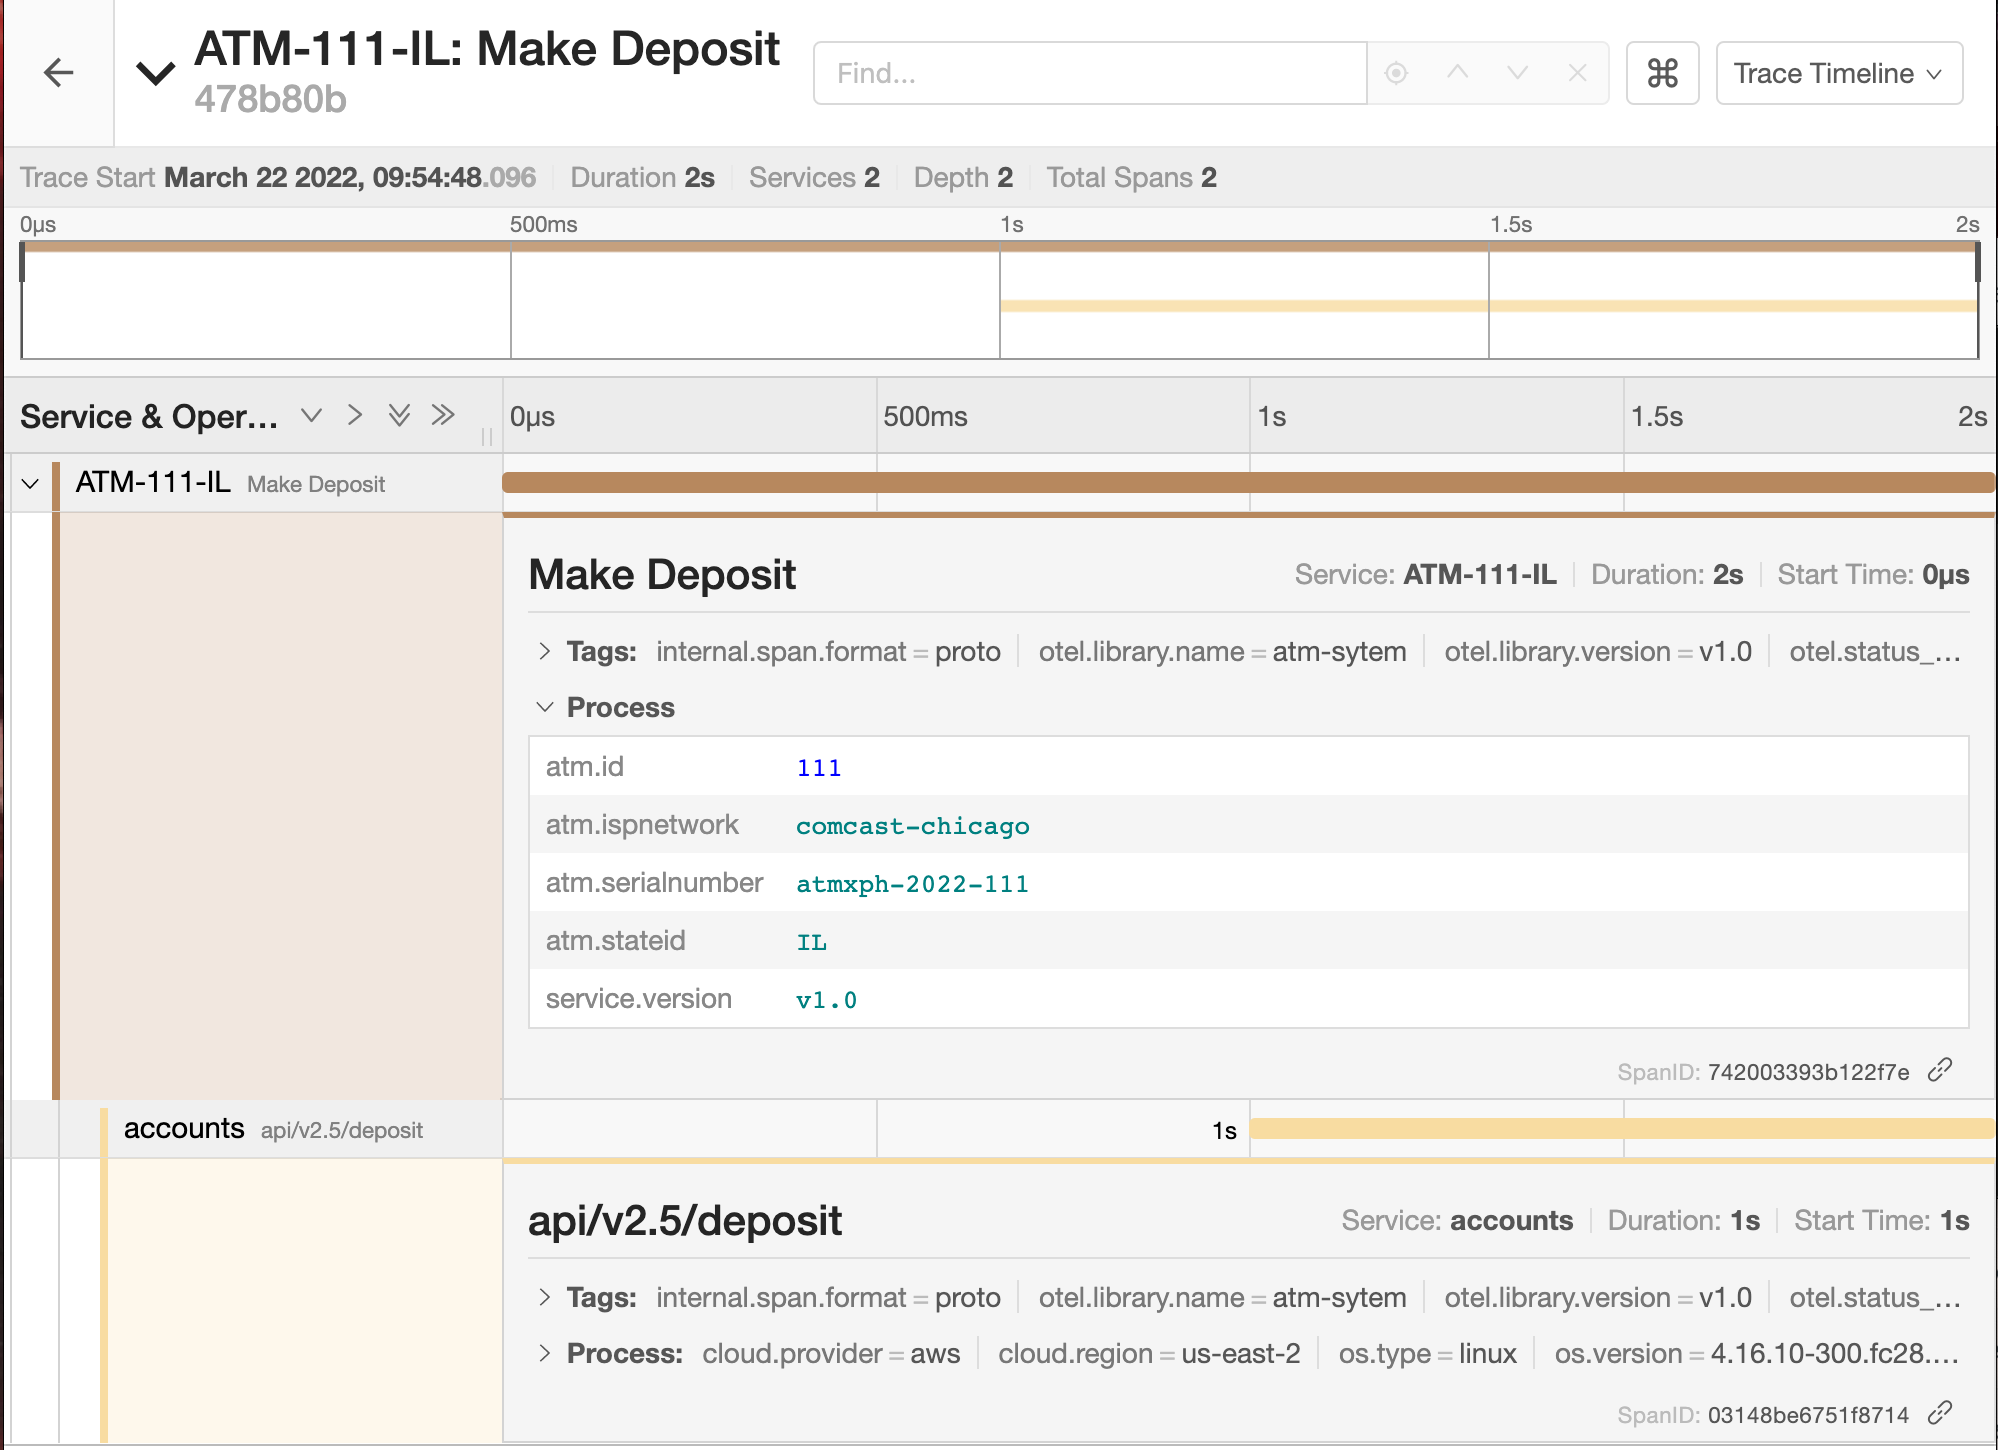
That’s it! You have now reached the end of this tutorial and successfully implemented a trace receiver, congratulations!
Feedback
Was this page helpful?
Thank you. Your feedback is appreciated!
Please let us know how we can improve this page. Your feedback is appreciated!