Collector Data Flow Dashboard
Monitoring data flow through the OpenTelemetry Collector is crucial for several reasons. Gaining a macro-level perspective on incoming data, such as sample counts and cardinality, is essential for comprehending the collector’s internal dynamics. However, when delving into the details, the interconnections can become complex. The Collector Data Flow Dashboard aims to demonstrate the capabilities of the OpenTelemetry demo application, offering a solid foundation for users to build upon. Collector Data Flow Dashboard provides valuable guidance on which metrics to monitor. Users can tailor their own dashboard variations by adding necessary metrics specific to their use cases, such as memory_delimiter processor or other data flow indicators. This demo dashboard serves as a starting point, enabling users to explore diverse usage scenarios and adapt the tool to their unique monitoring needs.
Data Flow Overview
The diagram below provides an overview of the system components, showcasing the configuration derived from the OpenTelemetry Collector (otelcol) configuration file utilized by the OpenTelemetry demo application. Additionally, it highlights the observability data (traces and metrics) flow within the system.
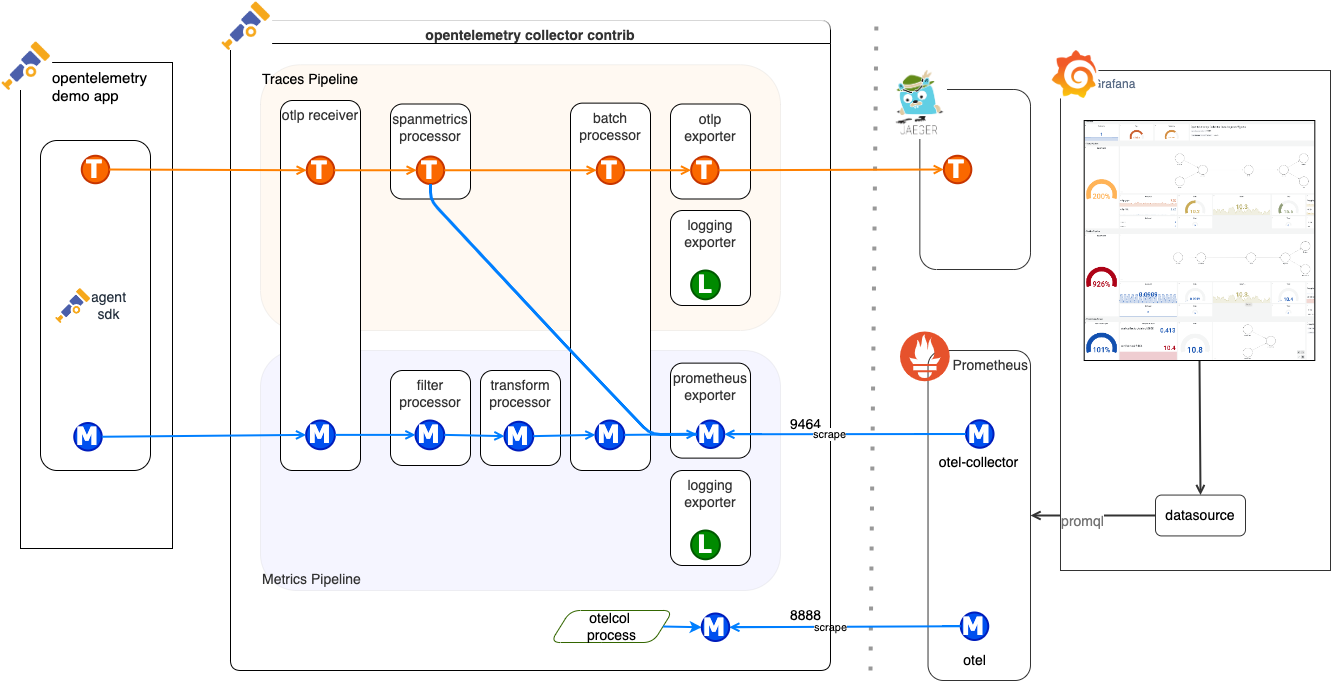
Ingress/Egress Metrics
The metrics depicted in the diagram below are employed to monitor both egress
and ingress data flows. These metrics are generated by the otelcol process,
exported on port 8888, and subsequently scraped by Prometheus. The namespace
associated with these metrics is “otelcol,” and the job name is labeled as
otel.
Labels serve as a valuable tool for identifying specific metric sets (such as exporter, receiver, or job), enabling differentiation among metric sets within the overall namespace. It is important to note that you will only encounter refused metrics if the memory limits, as defined in the memory delimiter processor, are exceeded.
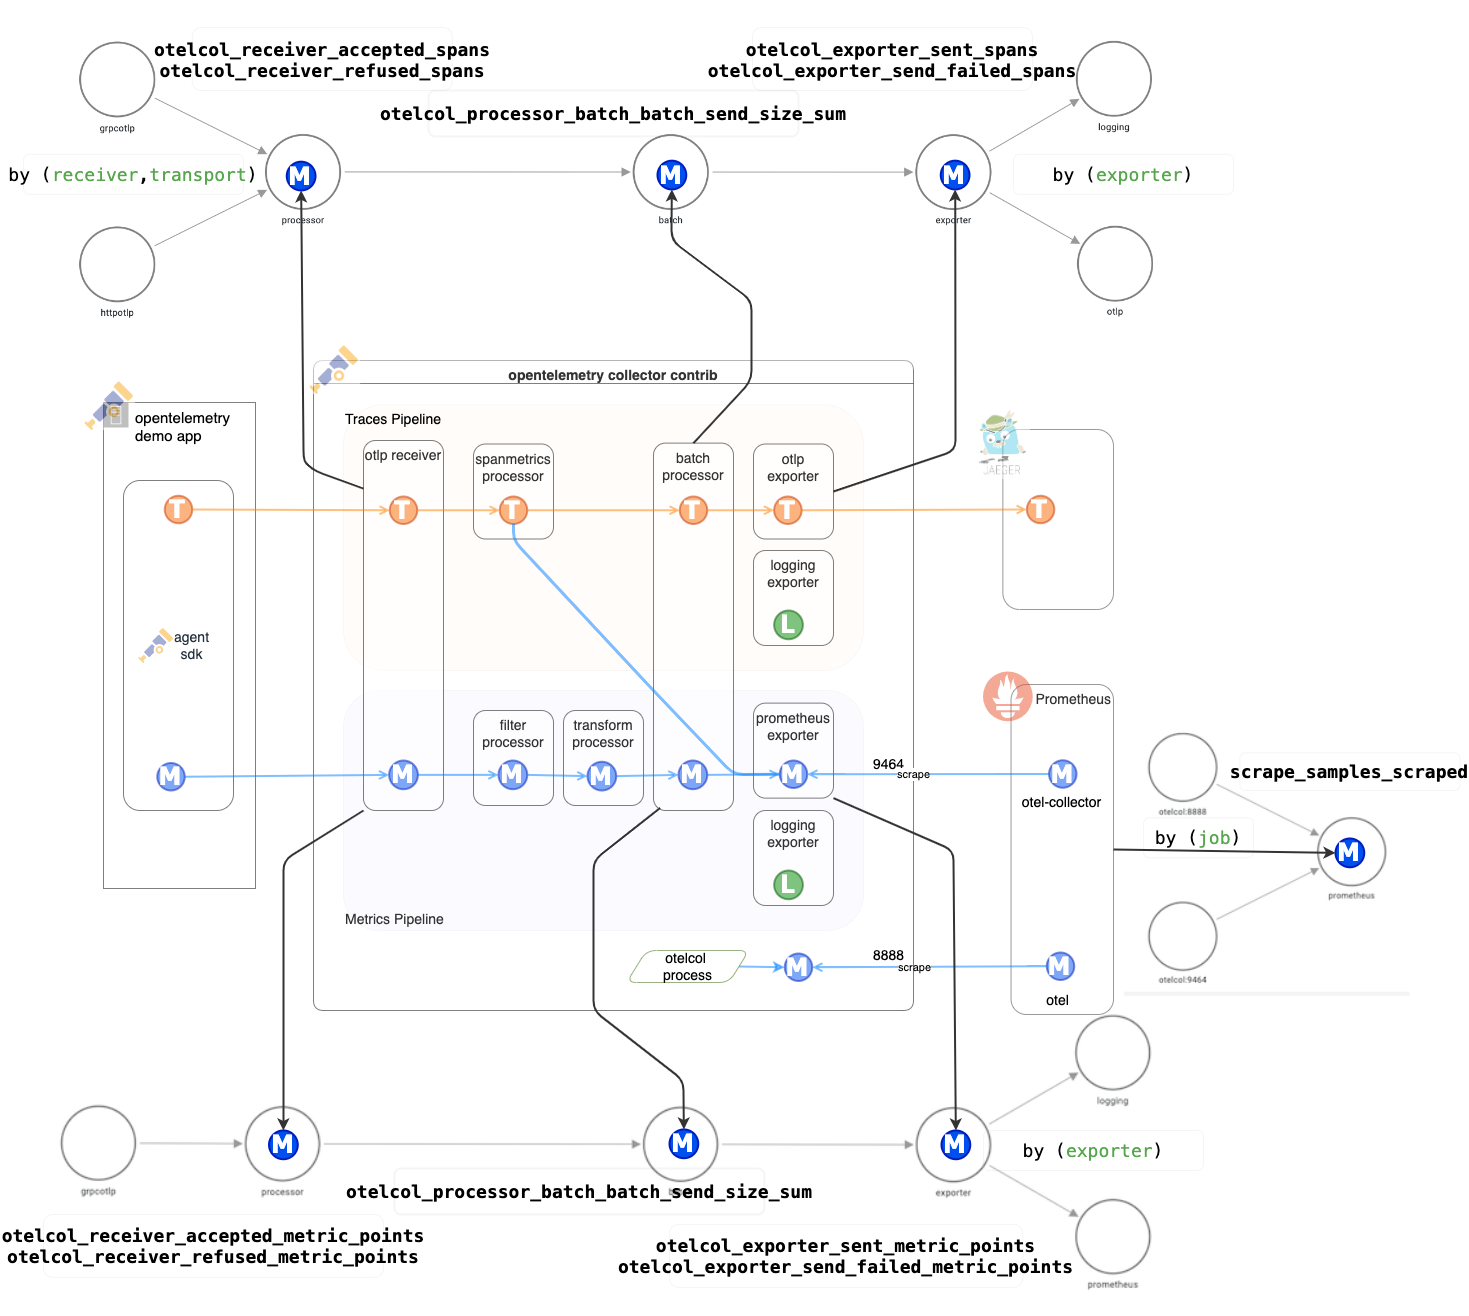
Ingress Traces Pipeline
otelcol_receiver_accepted_spansotelcol_receiver_refused_spansby (receiver,transport)
Ingress Metrics Pipeline
otelcol_receiver_accepted_metric_pointsotelcol_receiver_refused_metric_pointsby (receiver,transport)
Processor
Currently, the only processor present in the demo application is a batch processor, which is used by both traces and metrics pipelines.
otelcol_processor_batch_batch_send_size_sum
Egress Traces Pipeline
otelcol_exporter_sent_spansotelcol_exporter_send_failed_spansby (exporter)
Egress Metrics Pipeline
otelcol_exporter_sent_metric_pointsotelcol_exporter_send_failed_metric_pointsby (exporter)
Prometheus Scraping
scrape_samples_scrapedby (job)
Dashboard
You can access the dashboard by navigating to the Grafana UI, selecting the OpenTelemetry Collector dashboard under browse icon on the left-hand side of the screen.
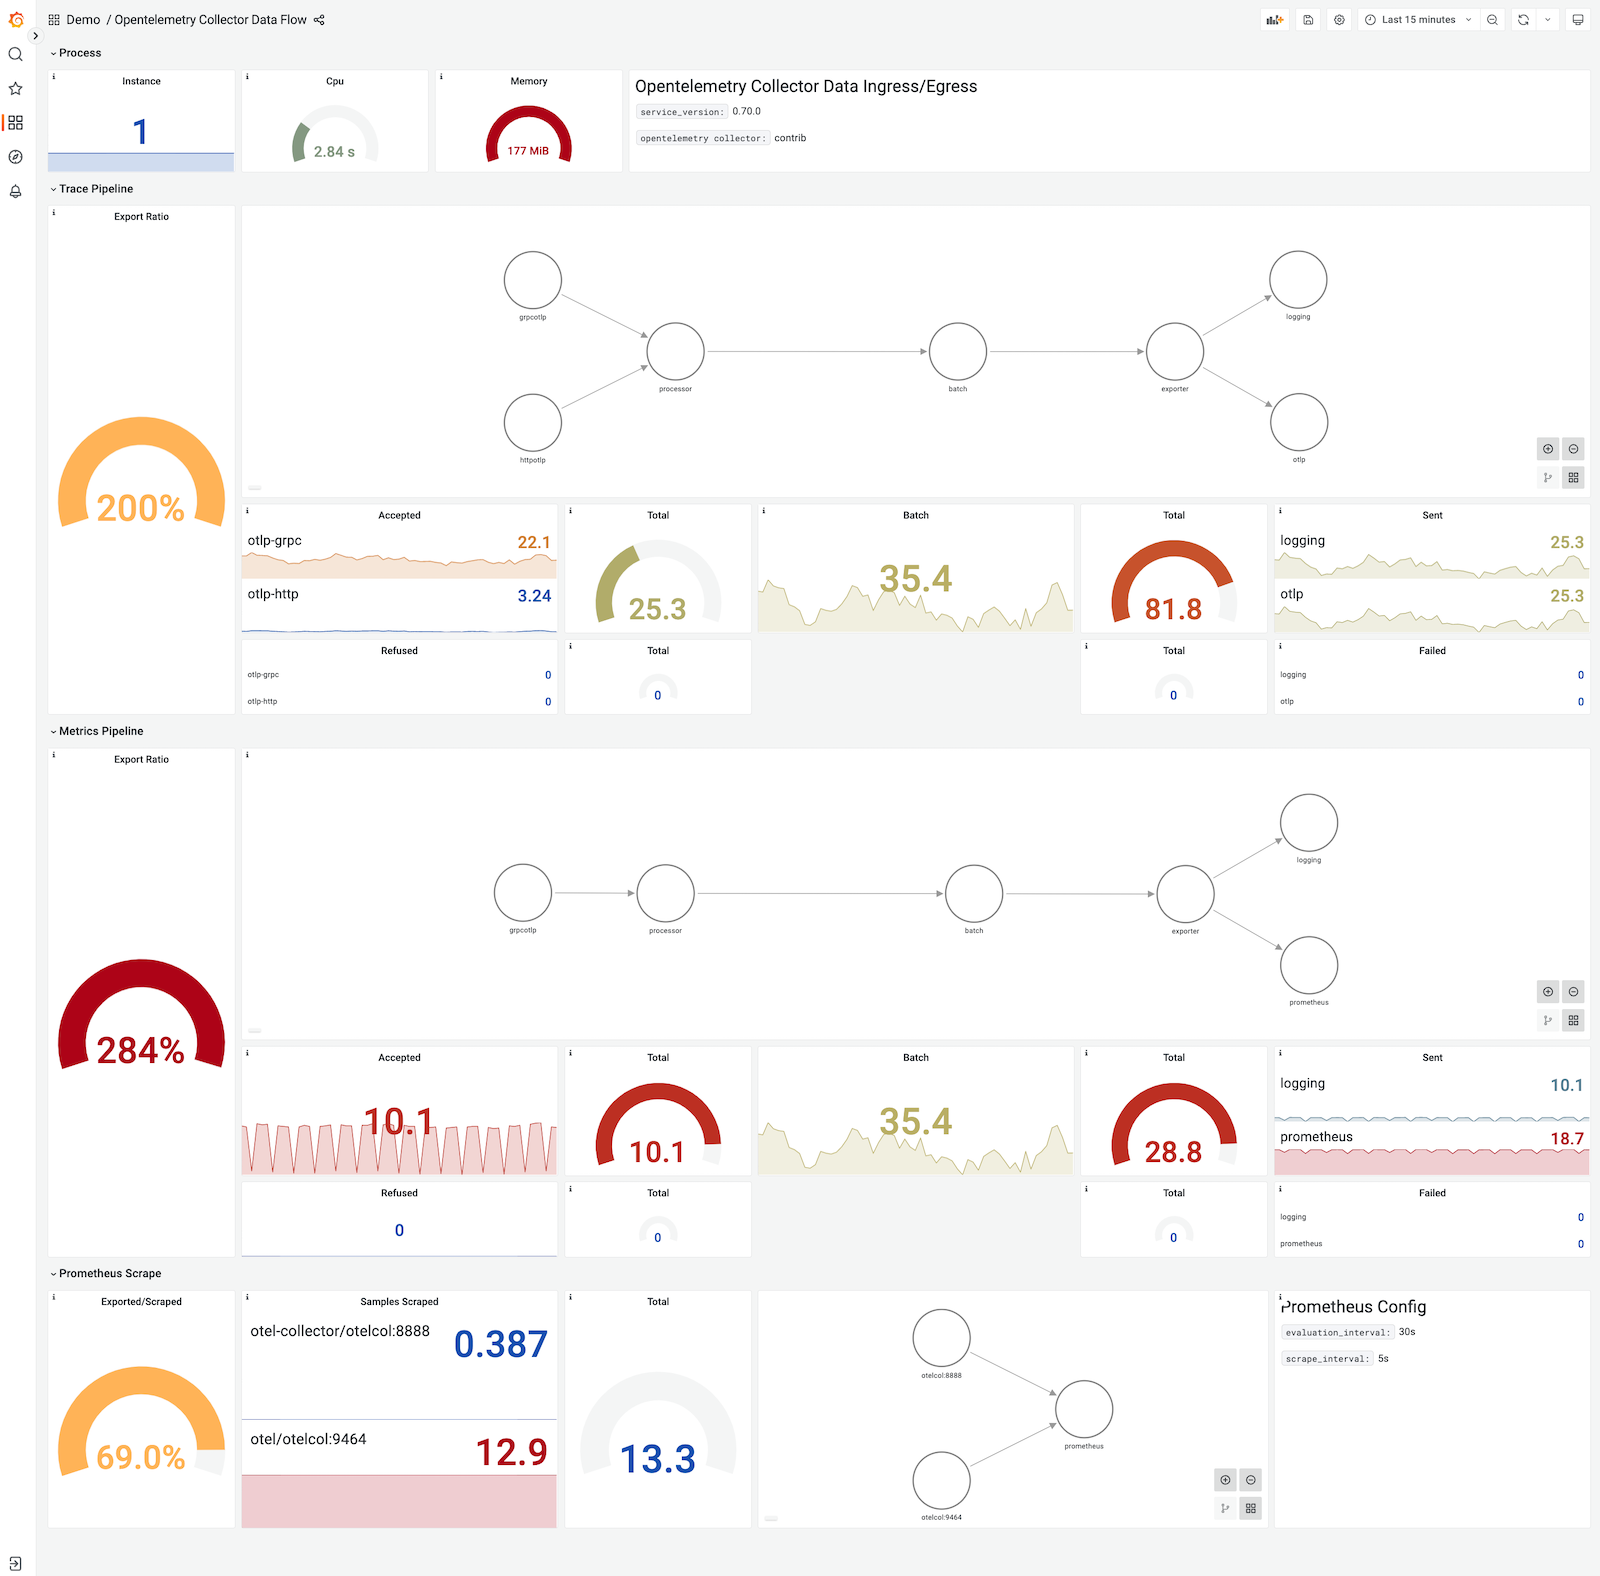
The dashboard has four main sections:
- Process Metrics
- Traces Pipeline
- Metrics Pipeline
- Prometheus Scraping
Sections 2,3 and 4 represent overall data flow using the metrics mentioned above. Additionally, export ratio is calculated for each pipeline to understand the data flow.
Export Ratio
Export ratio is basically the ratio between receiver and exporter metrics. You can notice over the dashboard screenshot above that the export ratio on metrics is way too high than the received metrics. This is because the demo application is configured to generate span metrics which is a processor that generates metrics from spans inside collector as illustrated in overview diagram.
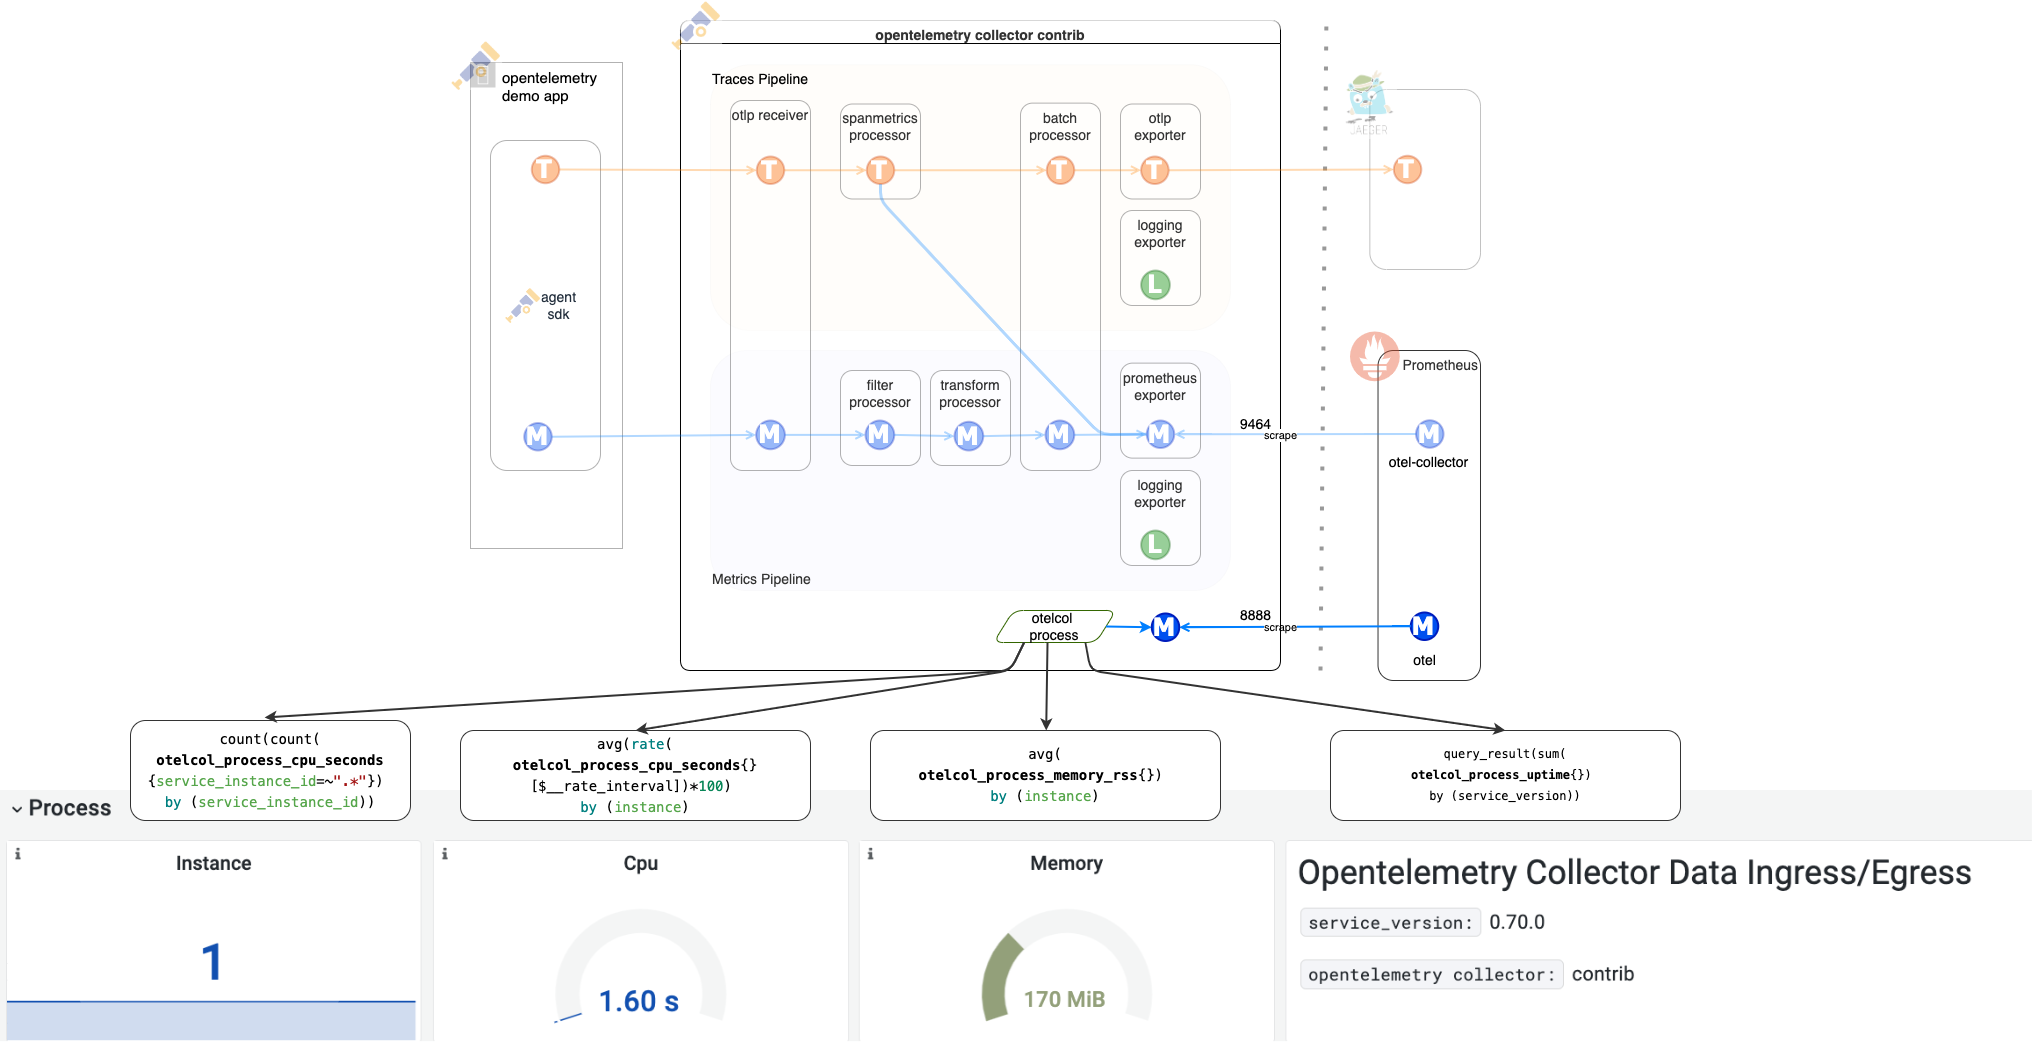
Process Metrics
Very limited but informative process metrics are added to dashboard. For example, you might observe more than one instance of otelcol running on the system during restarts or similar. This can be useful for understanding spikes on dataflow.
Feedback
Was this page helpful?
Thank you. Your feedback is appreciated!
Please let us know how we can improve this page. Your feedback is appreciated!