Using Metrics and Traces to diagnose a memory leak
Application telemetry, such as the kind that OpenTelemetry can provide, is very useful for diagnosing issues in a distributed system. In this scenario, we will walk through a scenario demonstrating how to move from high-level metrics and traces to determine the cause of a memory leak.
Setup
To run this scenario, you will need to deploy the demo application and enable
the recommendationServiceCacheFailure feature flag. Let the application run
for about 10 minutes or so after enabling the feature flag to allow for data to
populate.
Diagnosis
The first step in diagnosing a problem is to determine that a problem exists. Often the first stop will be a metrics dashboard provided by a tool such as Grafana.
A demo dashboard folder should exist after launching the demo with two dashboards; One is to monitor your OpenTelemetry Collector, and the other contains several queries and charts to analyze latency and request rate from each service.
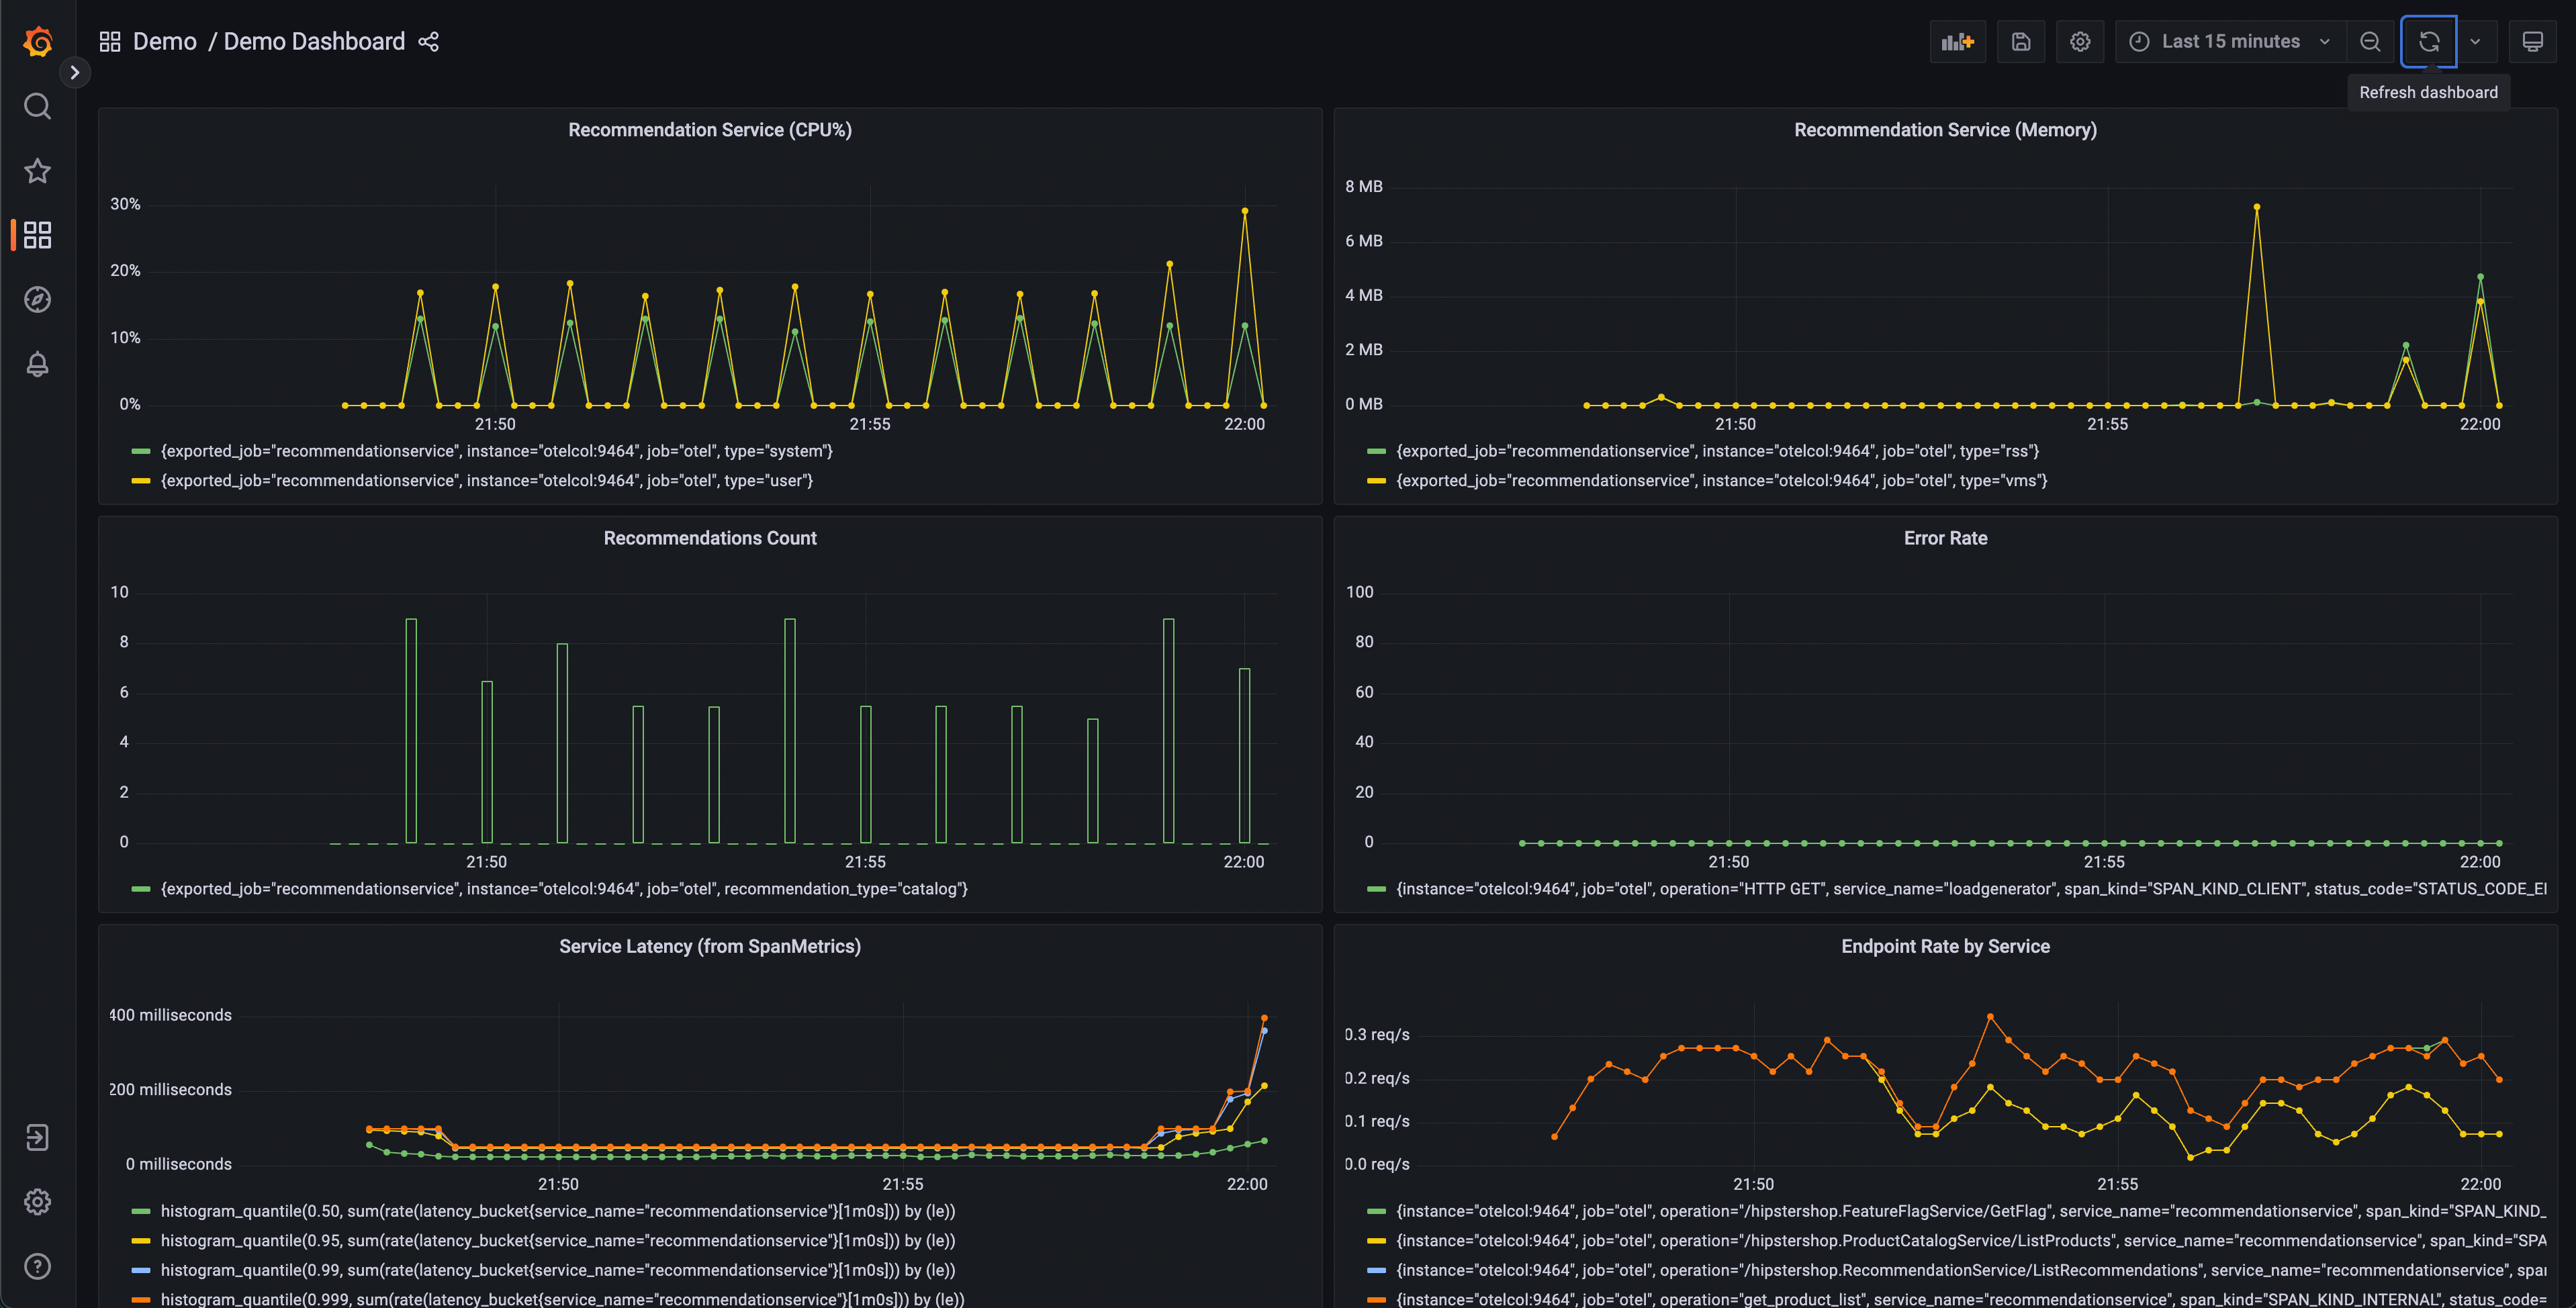
This dashboard will contain a number of charts, but a few should appear interesting:
- Recommendation Service (CPU% and Memory)
- Service Latency (from SpanMetrics)
- Error Rate
Recommendation Service charts are generated from OpenTelemetry Metrics exported to Prometheus, while the Service Latency and Error Rate charts are generated through the OpenTelemetry Collector Span Metrics processor.
From our dashboard, we can see that there seems to be anomalous behavior in the recommendation service – spiky CPU utilization, as well as long tail latency in our p95, 99, and 99.9 histograms. We can also see that there are intermittent spikes in the memory utilization of this service.
We know that we’re emitting trace data from our application as well, so let’s think about another way that we’d be able to determine that a problem exists.
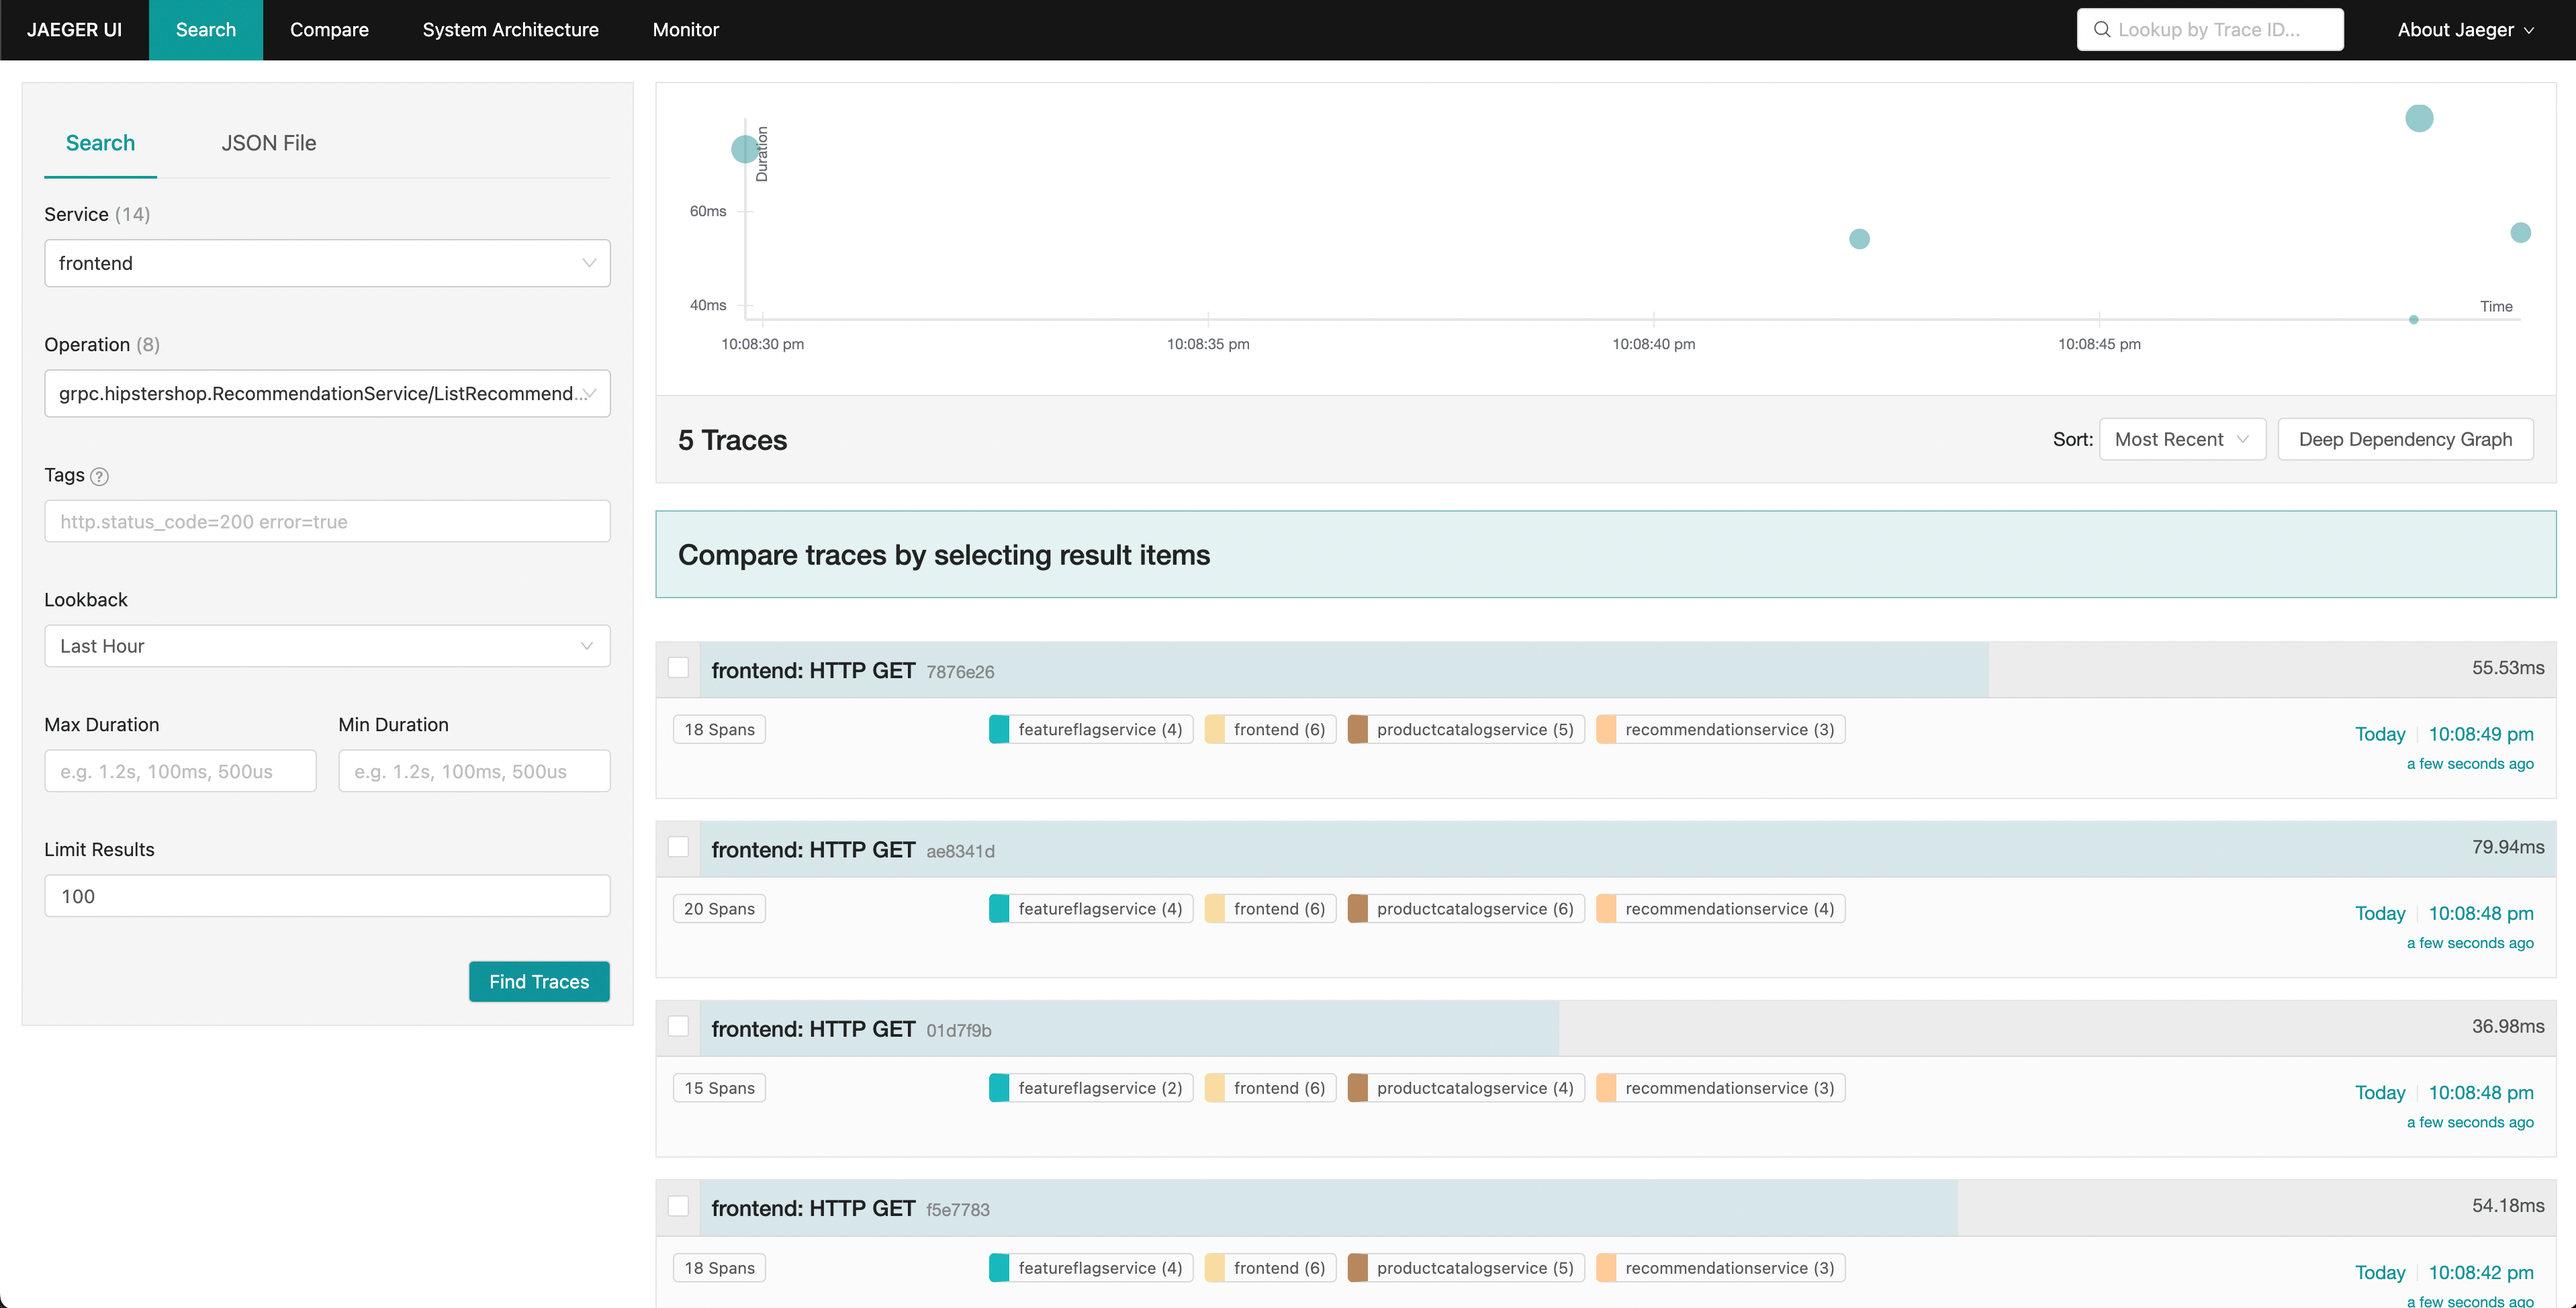
Jaeger allows us to search for traces and display the end-to-end latency of an entire request with visibility into each individual part of the overall request. Perhaps we noticed an increase in tail latency on our frontend requests. Jaeger allows us to then search and filter our traces to include only those that include requests to the recommendation service.
By sorting by latency, we’re able to quickly find specific traces that took a long time. Clicking on a trace in the right panel, we’re able to view the waterfall view.
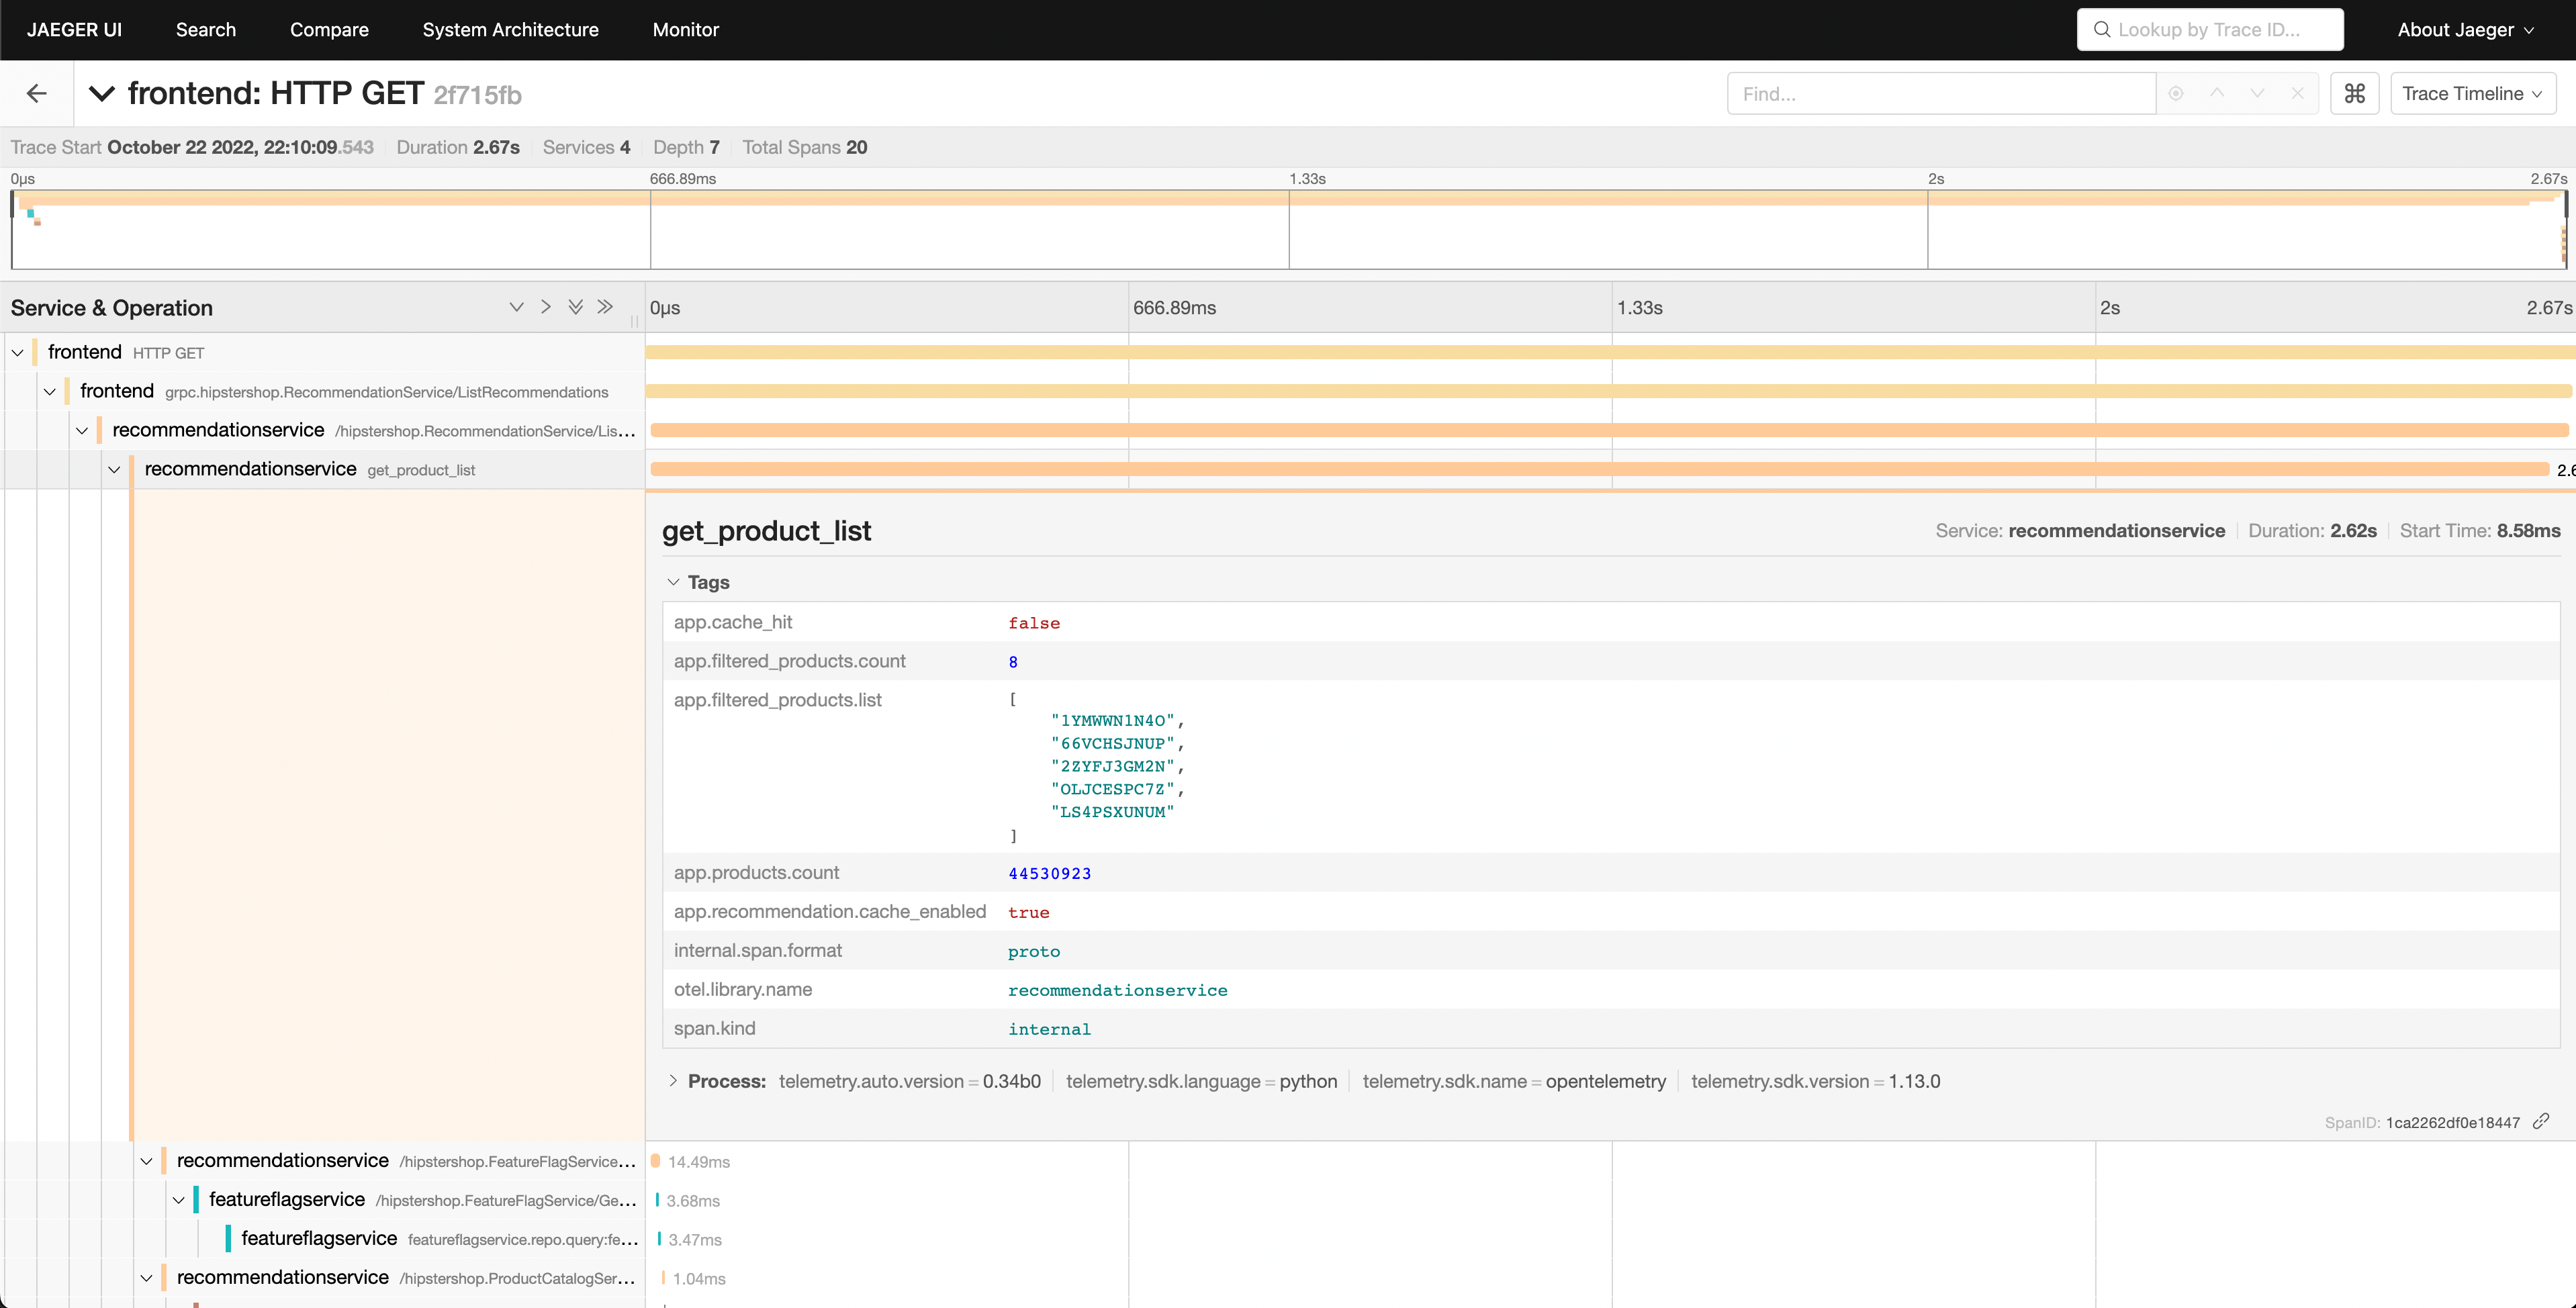
We can see that the recommendation service is taking a long time to complete its work, and viewing the details allows us to get a better idea of what’s going on.
Confirming the Diagnosis
We can see in our waterfall view that the app.cache_hit attribute is set to
false, and that the app.products.count value is extremely high.
Returning to the search UI, select recommendation in the Service dropdown, and
search for app.cache_hit=true in the Tags box. Notice that requests tend to be
faster when the cache is hit. Now search for app.cache_hit=false and compare
the latency. You should notice some changes in the visualization at the top of
the trace list.
Now, since this is a contrived scenario, we know where to find the underlying bug in our code. However, in a real-world scenario, we may need to perform further searching to find out what’s going on in our code, or the interactions between services that cause it.
Feedback
Was this page helpful?
Thank you. Your feedback is appreciated!
Please let us know how we can improve this page. Your feedback is appreciated!