OpenTelemetry Logging
Introduction
Of all telemetry signals logs have probably the biggest legacy. Most programming languages have built-in logging capabilities or well-known, widely used logging libraries.
For metrics and traces OpenTelemetry takes the approach of a clean-sheet design, specifies a new API and provides full implementations of this API in multiple languages.
Our approach with logs is somewhat different. For OpenTelemetry to be successful in logging space we need to support existing legacy of logs and logging libraries, while offering improvements and better integration with the rest of observability world where possible.
This is in essence the philosophy behind OpenTelemetry’s logs support. We embrace existing logging solutions and make sure OpenTelemetry works nicely with existing logging libraries, log collection and processing solutions.
Limitations of non-OpenTelemetry Solutions
Unfortunately existing logging solutions are currently weakly integrated with the rest of the observability signals. Logs typically have limited support in tracing and monitoring tools in the form of links that use available and often incomplete correlation information (such as the time and origin attributes). This correlation may be fragile because attributes are often added to logs, traces and metrics via different means (e.g. using different collection agents). There is no standardized way to include the information about the origin and source of logs (such as the application and the location/infrastructure where the application runs) that is uniform with traces and metrics and allows all telemetry data to be fully correlated in a precise and robust manner.
Similarly, logs have no standardized way to propagate and record the request execution context. In distributed systems this often results in a disjoint set of logs collected from different components of the system.
This is how a typical non-OpenTelemetry observability collection pipeline looks like today:
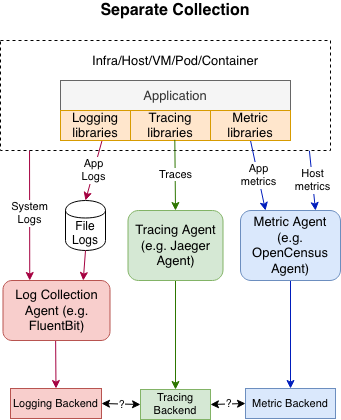
There are often different libraries and different collection agents, using different protocols and data models, with telemetry data ending up in separate backends that don’t know how to work well together.
OpenTelemetry Solution
Distributed tracing introduced the notion of trace context propagation.
Fundamentally, though, nothing prevents the logs to adopt the same context propagation concepts. If the recorded logs contained trace context identifiers (such as trace and span IDs or user-defined baggage) it would result in much richer correlation between logs and traces, as well as correlation between logs emitted by different components of a distributed system. This would make logs significantly more valuable in distributed systems.
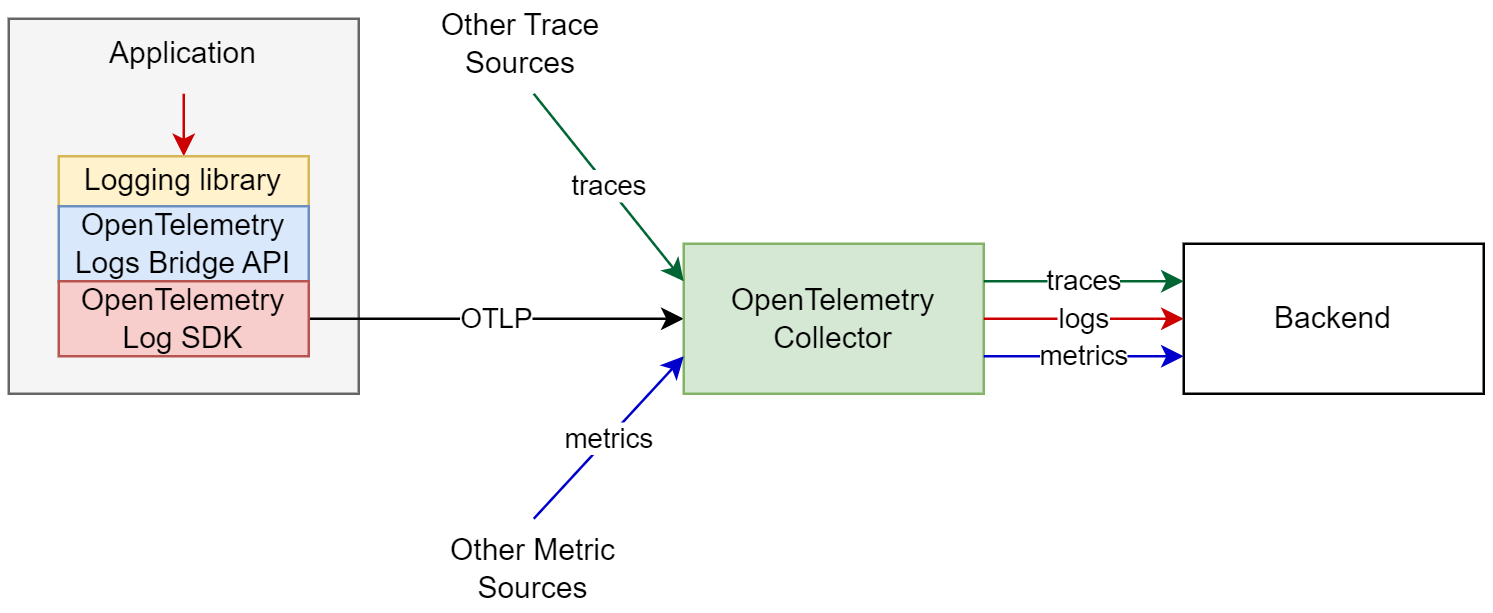
This is one of the promising evolutionary directions for observability tools. Standardizing log correlation with traces and metrics, adding support for distributed context propagation for logs, unification of source attribution of logs, traces and metrics will increase the individual and combined value of observability information for legacy and modern systems. This is the vision of OpenTelemetry’s collection of logs, traces and metrics:
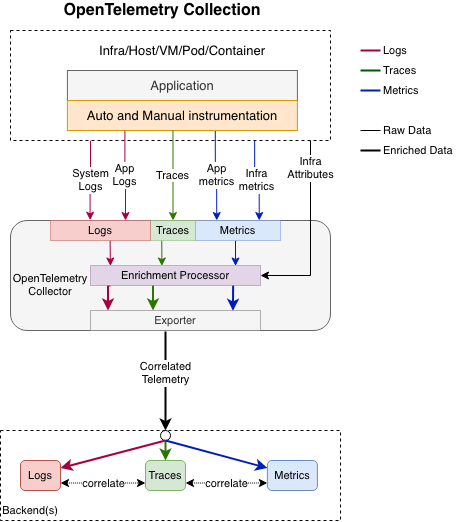
We emit logs, traces and metrics in a way that is compliant with OpenTelemetry data models, send the data through OpenTelemetry Collector, where it can be enriched and processed in a uniform manner. For example, Collector can add to all telemetry data coming from a Kubernetes Pod several attributes that describe the pod and it can be done automatically using k8sattributesprocessor without the need for the Application to do anything special. Most importantly such enrichment is completely uniform for all 3 signals. The Collector guarantees that logs, traces and metrics have precisely the same attribute names and values describing the Kubernetes Pod that they come from. This enables exact and unambiguous correlation of the signals by the Pod in the backend.
For traces and metrics OpenTelemetry defines a new API that application developers must use to emit traces and metrics.
For logs we did not take the same path. We realized that there is a much bigger and more diverse legacy in logging space. There are many existing logging libraries in different languages, each having their own API. Many programming languages have established standards for using particular logging libraries. For example in Java world there are several highly popular and widely used logging libraries, such as Log4j or Logback.
There are also countless existing prebuilt applications or systems that emit logs in certain formats. Operators of such applications have no or limited control on how the logs are emitted. OpenTelemetry needs to support these logs.
Given the above state of the logging space we took the following approach:
OpenTelemetry defines a log data model. The purpose of the data model is to have a common understanding of what a LogRecord is, what data needs to be recorded, transferred, stored and interpreted by a logging system.
Newly designed logging systems are expected to emit logs according to OpenTelemetry’s log data model. More on this later.
Existing log formats can be unambiguously mapped to OpenTelemetry log data model. OpenTelemetry Collector can read such logs and translate them to OpenTelemetry log data model.
OpenTelemetry defines a Logs API for emitting LogRecords. It was primarily designed for library authors to build log appenders, which use the API to bridge between existing logging libraries and the OpenTelemetry log data model. The Logs API can also be used directly by applications, which is particularly important for:
- Instrumentation libraries to avoid coupling to a particular logging library.
- Emitting structured events following semantic conventions, especially when the existing logging library cannot emit structured data or specify event names.
- Scenarios requiring direct control over log emission without intermediary logging library.
Note that existing logging libraries generally provide a much richer set of features than what is defined in OpenTelemetry. Yet, languages may provide an ergonomic API for better developer experience when using it directly.
OpenTelemetry defines an SDK implementation of the API, which enables configuration of processing and exporting LogRecords.
This approach allows OpenTelemetry to read existing system and application logs, provides a way for newly built application to emit rich, structured, OpenTelemetry-compliant logs, and ensures that all logs are eventually represented according to a uniform log data model on which the backends can operate.
Later in this document we will discuss in more details how various log sources are handled by OpenTelemetry, but first we need to describe in more details an important concept: the log correlation.
Log Correlation
Logs can be correlated with the rest of observability data in a few dimensions:
By the time of execution. Logs, traces and metrics can record the moment of time or the range of time the execution took place. This is the most basic form of correlation.
By the execution context, also known as the trace context. It is a standard practice to record the execution context (trace and span IDs as well as user-defined context) in the spans. OpenTelemetry extends this practice to logs where possible by including TraceId and SpanId in the LogRecords. This allows to directly correlate logs and traces that correspond to the same execution context. It also allows to correlate logs from different components of a distributed system that participated in the particular request execution.
By the origin of the telemetry, also known as the Resource context. OpenTelemetry traces and metrics contain information about the Resource they come from. We extend this practice to logs by including the Resource in LogRecords.
These 3 correlations can be the foundation of powerful navigational, filtering, querying and analytical capabilities. OpenTelemetry aims to record and collects logs in a manner that enables such correlations.
Legacy and Modern Log Sources
It is important to distinguish several sorts of legacy and modern log sources. Firstly, this directly affects how exactly we get access to these logs and how we collect them. Secondly, we have varying levels of control over how these logs are generated and whether we can amend the information that can be included in the logs.
Below we list several categories of logs and describe what can be possibly done for each category to have better experience in the observability solutions.
System Logs
These are logs generated by the operating system and over which we have no control. We cannot change the format or affect what information is included. Examples of system format are Syslog and Windows Event Logs.
System logs are written at the host level (which may be physical, virtual or containerized) and have a predefined format and content (note that applications may also be able to write records to standard system logs: this case is covered below in the Third-Party Applications section).
System operations recorded in the logs can be a result of a request execution. However system logs either do not include any data about the trace context or if included it is highly idiosyncratic and thus difficult to identify, parse and use. This makes it nearly impossible to perform trace context correlation for system logs. However we can and should automatically enrich system logs with the resource context - the information about the host that is available during collection. This can include the hostname, IP address, container or pod name, etc. This information should be added to the Resource field of collected log data.
OpenTelemetry Collector can read system logs (link TBD) and automatically enrich them with Resource information using the resourcedetection processor.
Infrastructure Logs
These are logs generated by various infrastructure components, such as Kubernetes events. Like system logs, the infrastructure logs lack a trace context and can be enriched by the resource context - information about the node, pod, container, etc.
OpenTelemetry Collector or other agents can be used to query logs from most common infrastructure controllers.
Third-party Application Logs
Applications typically write logs to standard output, to files or other specialized medium (e.g. Windows Event Logs for applications). These logs can be in many different formats, spanning a spectrum along these variations:
Free-form text formats with no easily automatable and reliable way to parse structured data from them.
Better specified and sometimes customizable formats that can be parsed to extract structured data (such as Apache logs or RFC5424 Syslog).
Formally structured formats (e.g. JSON files with well-defined schema or Windows Event Log).
The collection system needs to be able to discover most commonly used applications and have parsers that can convert these logs into a structured format. Like system and infrastructure logs, application logs often lack request context but can be enriched by resource context, including the attributes that describe the host and infrastructure as well as application-level attributes (such as the application name, version, name of the database - if it is a DBMS, etc).
OpenTelemetry recommends to collect application logs using Collector’s filelog receiver. Alternatively, another log collection agent, such as FluentBit, can collect logs, then send to OpenTelemetry Collector where the logs can be further processed and enriched.
Legacy First-Party Applications Logs
These are applications that are created in-house. People tasked with setting up log collection infrastructure sometimes are able to modify these applications to alter how logs are written and what information is included in the logs. For example, the application’s log formatters may be reconfigured to output JSON instead of plain text and by doing so help improve the reliability of log collection.
More significant modifications to these applications can be done manually by their developers, such as addition of the trace context to every log statement, however this is likely going to be vanishingly rare due to the effort required.
As opposed to manual efforts we have an interesting opportunity to “upgrade” application logs in a less laborious way by providing full or semi auto-instrumenting solutions that modify trace logging libraries used by the application to automatically output the trace context such as the trace ID or span ID with every log statement. The trace context can be automatically extracted from incoming requests if standard compliant request propagation is used, e.g. via W3C TraceContext. In addition, the requests outgoing from the application may be injected with the same trace context data, thus resulting in context propagation through the application and creating an opportunity to have full trace context in logs collected from all applications that can be instrumented in this manner.
Some logging libraries are designed to be extended in this manner relatively easily. There is no need to actually modify the libraries, instead we can implement “log appender” or “log bridge” components for such libraries and implement the additional LogRecord enrichment in these components.
There are typically 2 ways to collect logs from these applications.
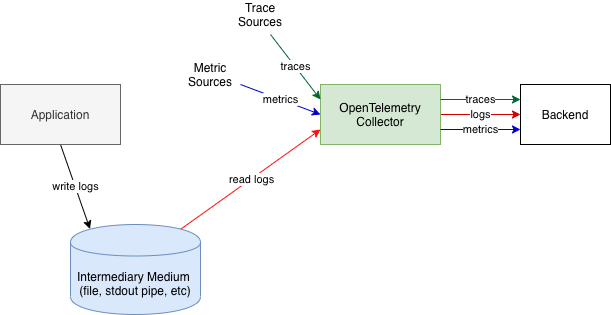
Via File or Stdout Logs
The first approach, assuming the logs are written to files or to standard output, requires ability to read file logs, tail them, work correctly when log rotation is used, optionally also parse the logs to convert them into more structured formats. Parsing requires support for different parser types, which can also be configured to parse custom formats as well as ability to add custom parsers. Examples of common formats that parsers need to support are: CSV, Common Log Format, Labeled Tab-separated Values (LTSV), key-value Pair format, JSON, etc. To support this approach OpenTelemetry recommends to collect logs using OpenTelemetry Collector.
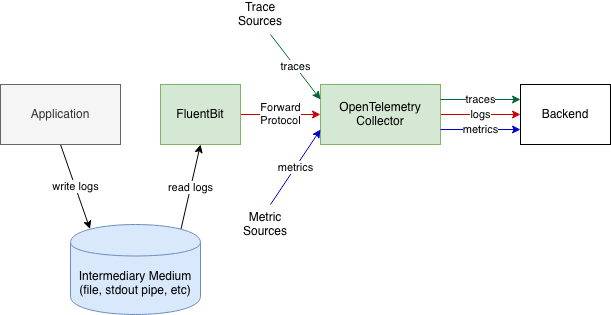
Alternatively, if the Collector does not have the necessary file reading and parsing capabilities, another log collection agent, such as FluentBit can collect the logs, then send the logs to OpenTelemetry Collector.
The benefit of using an intermediary medium is that how logs are produced and where they are written by the application requires no or minimal changes. The downside is that it requires the often non-trivial log file reading and parsing functionality. Parsing may also be not reliable if the output format is not well-defined. For details on recording and parsing trace context, see Trace Context in Non-OTLP Log Formats.
Direct to Collector
The second approach is to modify the application so that the logs are output via a network protocol, e.g. via OTLP. The most convenient way to achieve this is to provide addons or extensions to the commonly used logging libraries. The addons implement sending over such network protocols, which would then typically require small, localized changes to the application code to change the logging target.
The application logs will be also enriched by the resource context, similarly to how it is done for third-party applications and so will potentially have full correlation information across all context dimensions.
The downside of this approach is that the simplicity of having the logs in a local file is lost (e.g. ability to easily inspect the log file locally) and requires a full buy-in in OpenTelemetry’s logging approach. This approach also only works if the destination that the logs need to be delivered is able to receive logs via the network protocol that OpenTelemetry can send in.
The benefits of this approach is that it emits the logs in well-defined, formal, highly structured format, removes all complexity associated with file logs, such as parsers, log tailing and rotation. It also enables the possibility to send logs directly to the logging backend without using a log collection agent.
To facilitate both approaches described above OpenTelemetry provides a API and SDK, which can be used together with existing logging libraries to automatically inject the trace context in the emitted logs, and provide an easy way to send the logs via OTLP. Instead of modifying each logging statement, log appenders use the API to bridge logs from existing logging libraries to the OpenTelemetry data model, where the SDK controls how the logs are processed and exported. Application developers only need to configure the Appender and SDK at application startup.
New First-Party Application Logs
These are greenfield developments. OpenTelemetry provides recommendations and best practices about how to emit logs (along with traces and metrics) from these applications.
Applications have several options for emitting logs:
Using existing logging libraries with OpenTelemetry log appenders: For applicable languages and frameworks, auto-instrumentation or simple configuration of a logging library to use an OpenTelemetry log appender will be the easiest way to emit context-enriched logs. As already described earlier, we provide extensions to some popular logging libraries to support manual instrumentation cases. The extensions support the inclusion of the trace context in the logs and allow sending logs via OTLP protocol to the backend or to the Collector, bypassing the need to have the logs represented as text files.
Using the OpenTelemetry Logs API directly: Applications can use the Logs API directly to emit structured logs and events. This approach works well for emitting events following semantic conventions and enables easier reuse of attributes used across different signals. Note that a language can provide a more convenient ergonomic API.
Regardless of the approach, emitted logs are automatically augmented by application-specific resource context (e.g. process ID, programming language, logging library name and version, etc). Full correlation across all context dimensions will be available for these logs.
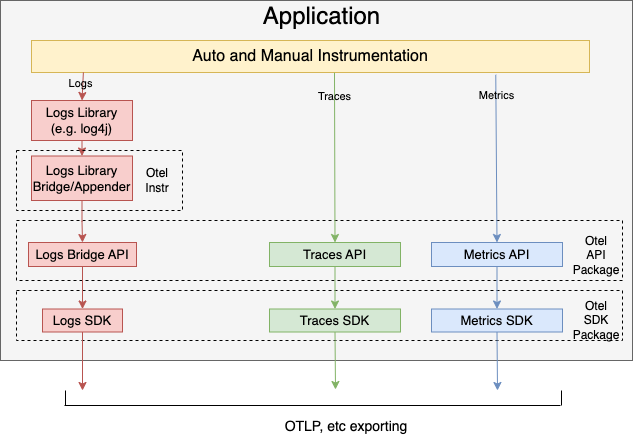
This is how a typical new application uses OpenTelemetry API, SDK and the existing log libraries:
OpenTelemetry Collector
To enable log collection according to this specification we use OpenTelemetry Collector.
The following functionality exists to enable log collection:
Support for log data type and log pipelines based on the log data model. This includes processors such as attributesprocessor that can operate on log data.
Ability to read logs from text files, tail the files, understand common log rotation schemes, watch directories for log file creation, ability to checkpoint file positions and resume reading from checkpoints. This ability is implemented by using Collector’s filelog receiver or using an externally running agent (such as FluentBit).
Ability to parse logs in common text formats and to allow end users to customize parsing formats and add custom parsers as needed. Collector’s parsers or parsing in the external agent is used for this.
Ability to receive logs via common network protocols for logs, such as Syslog and interpret them according to semantic conventions defined in this specification. FluentBit or similar agent is used for this. Over time some of this functionality may be migrated directly to the Collector.
Ability to send logs via common network protocols for logs, such as Syslog, or vendor-specific log formats. Collector contains exporters that directly implement this ability.
Auto-Instrumenting Existing Logging
We can provide auto-instrumentation for most popular logging libraries. The auto-instrumented logging statements will do the following:
Read incoming trace context (this is part of broader instrumentation that auto-instrumenting libraries perform).
Configure logging libraries to use trace ID and span ID fields from request context as logging context and automatically include them in all logged statements.
This is possible to do for certain languages (e.g. in Java) and we can reuse existing open source libraries that do this.
A further optional modification would be to auto-instrument loggers to send logs directly to the backend via OTLP instead or in addition to writing to a file or standard output.
Specifications
References
Feedback
Was this page helpful?
Thank you. Your feedback is appreciated!
Please let us know how we can improve this page. Your feedback is appreciated!