Overview
This document provides an overview of the OpenTelemetry project and defines important fundamental terms.
Additional term definitions can be found in the glossary.
OpenTelemetry Client Architecture
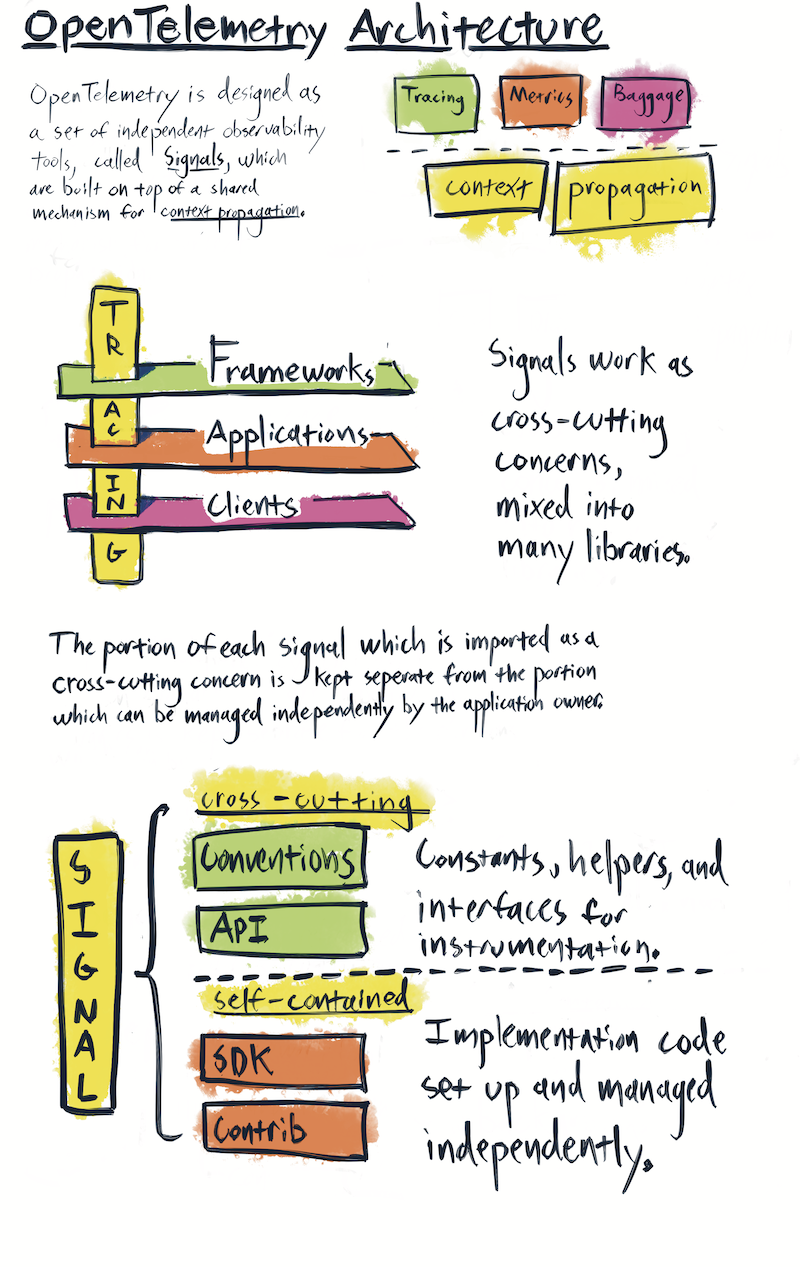
At the highest architectural level, OpenTelemetry clients are organized into signals. Each signal provides a specialized form of observability. For example, tracing, metrics, and baggage are three separate signals. Signals share a common subsystem – context propagation – but they function independently from each other.
Each signal provides a mechanism for software to describe itself. A codebase, such as web framework or a database client, takes a dependency on various signals in order to describe itself. OpenTelemetry instrumentation code can then be mixed into the other code within that codebase. This makes OpenTelemetry a cross-cutting concern - a piece of software which is mixed into many other pieces of software in order to provide value. Cross-cutting concerns, by their very nature, violate a core design principle – separation of concerns. As a result, OpenTelemetry client design requires extra care and attention to avoid creating issues for the codebases which depend upon these cross-cutting APIs.
OpenTelemetry clients are designed to separate the portion of each signal which must be imported as cross-cutting concerns from the portions which can be managed independently. OpenTelemetry clients are also designed to be an extensible framework. To accomplish these goals, each signal consists of four types of packages: API, SDK, Semantic Conventions, and Contrib.
API
API packages consist of the cross-cutting public interfaces used for instrumentation. Any portion of an OpenTelemetry client which is imported into third-party libraries and application code is considered part of the API.
SDK
The SDK is the implementation of the API provided by the OpenTelemetry project. Within an application, the SDK is installed and managed by the application owner. Note that the SDK includes additional public interfaces which are not considered part of the API package, as they are not cross-cutting concerns. These public interfaces are defined as constructors and plugin interfaces. Application owners use the SDK constructors; plugin authors use the SDK plugin interfaces. Instrumentation authors MUST NOT directly reference any SDK package of any kind, only the API.
Semantic Conventions
The Semantic Conventions define the keys and values which describe commonly observed concepts, protocols, and operations used by applications.
Semantic Conventions are now located in their own repository: https://github.com/open-telemetry/semantic-conventions
Both the collector and the client libraries SHOULD autogenerate semantic convention keys and enum values into constants (or language idiomatic equivalent). Generated values shouldn’t be distributed in stable packages until semantic conventions are stable. The YAML files MUST be used as the source of truth for generation. Each language implementation SHOULD provide language-specific support to the code generator.
Additionally, attributes required by the specification will be listed here.
Contrib Packages
The OpenTelemetry project maintains integrations with popular OSS projects which have been identified as important for observing modern web services. Example API integrations include instrumentation for web frameworks, database clients, and message queues. Example SDK integrations include plugins for exporting telemetry to popular analysis tools and telemetry storage systems.
Some plugins, such as OTLP Exporters and TraceContext Propagators, are required by the OpenTelemetry specification. These required plugins are included as part of the SDK.
Plugins and instrumentation packages which are optional and separate from the SDK are referred to as Contrib packages. API Contrib refers to packages which depend solely upon the API; SDK Contrib refers to packages which also depend upon the SDK.
The term Contrib specifically refers to the collection of plugins and instrumentation maintained by the OpenTelemetry project; it does not refer to third-party plugins hosted elsewhere.
Versioning and Stability
OpenTelemetry values stability and backwards compatibility. Please see the versioning and stability guide for details.
Tracing Signal
A distributed trace is a set of events, triggered as a result of a single logical operation, consolidated across various components of an application. A distributed trace contains events that cross process, network and security boundaries. A distributed trace may be initiated when someone presses a button to start an action on a website - in this example, the trace will represent calls made between the downstream services that handled the chain of requests initiated by this button being pressed.
Traces
Traces in OpenTelemetry are defined implicitly by their Spans. In particular, a Trace can be thought of as a directed acyclic graph (DAG) of Spans, where the edges between Spans are defined as parent/child relationship.
For example, the following is an example Trace made up of 6 Spans:
Causal relationships between Spans in a single Trace

        [Span A]  ←←←(the root span)
            |
     +------+------+
     |             |
 [Span B]      [Span C] ←←←(Span C is a `child` of Span A)
     |             |
 [Span D]      +---+-------+
               |           |
           [Span E]    [Span F]
Sometimes it’s easier to visualize Traces with a time axis as in the diagram below:
Temporal relationships between Spans in a single Trace

––|–––––––|–––––––|–––––––|–––––––|–––––––|–––––––|–––––––|–> time

 [Span A···················································]
   [Span B··········································]
      [Span D······································]
    [Span C····················································]
         [Span E·······]        [Span F··]
Spans
A span represents an operation within a transaction. Each Span encapsulates the following state:
- An operation name
- A start and finish timestamp
- Attributes: A list of key-value pairs.
- A set of zero or more Events, each of which is itself a tuple (timestamp, name, Attributes). The name must be strings.
- Parent’s Span identifier.
- Links to zero or more causally-related Spans (via the SpanContext of those related Spans).
- SpanContext information required to reference a Span. See below.
SpanContext
Represents all the information that identifies Span in the Trace and MUST be propagated to child Spans and across process boundaries. A SpanContext contains the tracing identifiers and the options that are propagated from parent to child Spans.
- TraceId is the identifier for a trace. It is worldwide unique with practically sufficient probability by being made as 16 randomly generated bytes. TraceId is used to group all spans for a specific trace together across all processes.
- SpanId is the identifier for a span. It is globally unique with practically sufficient probability by being made as 8 randomly generated bytes. When passed to a child Span this identifier becomes the parent span id for the child Span.
- TraceFlags represents the options for a trace. It is represented as 1
byte (bitmap).
- Sampling bit - Bit to represent whether trace is sampled or not (mask
0x1).
- Sampling bit - Bit to represent whether trace is sampled or not (mask
- Tracestate carries tracing-system specific context in a list of key value pairs. Tracestate allows different vendors propagate additional information and inter-operate with their legacy Id formats. For more details see this.
Links between spans
A Span may be linked to zero or more other Spans (defined by SpanContext) that are causally related. Links can point to Spans inside a single Trace or across different Traces. Links can be used to represent batched operations where a Span was initiated by multiple initiating Spans, each representing a single incoming item being processed in the batch.
Another example of using a Link is to declare the relationship between the originating and following trace. This can be used when a Trace enters trusted boundaries of a service and service policy requires the generation of a new Trace rather than trusting the incoming Trace context. The new linked Trace may also represent a long running asynchronous data processing operation that was initiated by one of many fast incoming requests.
When using the scatter/gather (also called fork/join) pattern, the root operation starts multiple downstream processing operations and all of them are aggregated back in a single Span. This last Span is linked to many operations it aggregates. All of them are the Spans from the same Trace. And similar to the Parent field of a Span. It is recommended, however, to not set parent of the Span in this scenario as semantically the parent field represents a single parent scenario, and in many cases the parent Span fully encloses the child Span. This is not the case in scatter/gather and batch scenarios.
Metric Signal
OpenTelemetry allows recording raw measurements or metrics with predefined aggregations and a set of attributes.
Using the OpenTelemetry API to record raw measurements gives end-users the flexibility to choose the aggregation algorithm for a given metric. This functionality is particularly useful in client libraries such as gRPC, where it enables the recording of raw measurements like “server_latency” or “received_bytes.” End-users then have the autonomy to decide on the aggregation method for these raw measurements, options for which range from straightforward averages to more complex histogram calculations.
Recording raw measurements
The primary components involved in recording raw measurements using the OpenTelemetry
API are Measurement, Instrument and Meter. A Meter is obtained from a
MeterProvider and used to create an Instrument, which is then responsible for capturing
measurements.
+------------------+
| MeterProvider    |                 +-----------------+             +--------------+
|   Meter A        | Measurements... |                 | Metrics...  |              |
|     Instrument X +-----------------> In-memory state +-------------> MetricReader |
|     Instrument Y |                 |                 |             |              |
|   Meter B        |                 +-----------------+             +--------------+
|     Instrument Z |
|     ...          |                 +-----------------+             +--------------+
|     ...          | Measurements... |                 | Metrics...  |              |
|     ...          +-----------------> In-memory state +-------------> MetricReader |
|     ...          |                 |                 |             |              |
|     ...          |                 +-----------------+             +--------------+
+------------------+
Instruments
Instruments are used to report Measurements, and are identified
by a name, kind, description, and unit of values.
There are several types of metric instruments for specific use cases, such as counters for incrementing values, gauges for capturing current values, and histograms for capturing distributions of measurements. Instruments can be synchronous, meaning that they are invoked inline by application logic, or asynchronous, where the user registers a callback function that is invoked on demand by the SDK.
Metrics data model and SDK
The Metrics data model is specified here and is based on metrics.proto. This data model defines three semantics: An Event model used by the API, an in-flight data model used by the SDK and OTLP, and a TimeSeries model which denotes how exporters should interpret the in-flight model.
Different exporters have different capabilities (e.g. which data types are supported) and different constraints (e.g. which characters are allowed in attribute keys). Metrics is intended to be a superset of what’s possible, not the lowest common denominator that’s supported everywhere. All exporters consume data from Metrics Data Model via a Metric Producer interface defined in OpenTelemetry SDK.
Because of this, Metrics puts minimal constraints on the data (e.g. which characters are allowed in keys), and code dealing with Metrics should avoid validation and sanitization of the Metrics data. Instead, pass the data to the backend, rely on the backend to perform validation, and pass back any errors from the backend.
See Metrics Data Model Specification for more information.
Views
Views are configurations that specify how the data from an Instrument should be processed,
aggregated, and exported. They can be configured through the MeterProvider. A View allows the customization of metric data beyond the default
collection behavior, enabling specific aggregations, transformations, and filtering of metrics.
Log Signal
Data model
Log Data Model defines how logs and events are understood by OpenTelemetry.
Baggage Signal
In addition to trace propagation, OpenTelemetry provides a simple mechanism for propagating
name/value pairs, called Baggage. Baggage is intended for
indexing observability events in one service with attributes provided by a prior service in
the same transaction. This helps to establish a causal relationship between these events.
While Baggage can be used to prototype other cross-cutting concerns, this mechanism is primarily intended
to convey values for the OpenTelemetry observability systems.
These values can be consumed from Baggage and used as additional attributes for metrics,
or additional context for logs and traces. Some examples:
- a web service can benefit from including context around what service has sent the request
- a SaaS provider can include context about the API user or token that is responsible for that request
- determining that a particular browser version is associated with a failure in an image processing service
For backward compatibility with OpenTracing, Baggage is propagated as Baggage when
using the OpenTracing bridge. New concerns with different criteria should consider creating a new
cross-cutting concern to cover their use-case; they may benefit from the W3C encoding format but
use a new HTTP header to convey data throughout a distributed trace.
Resources
Resource captures information about the entity for which telemetry is
recorded. For example, metrics exposed by a Kubernetes container can be linked
to a resource that specifies the cluster, namespace, pod, and container name.
Resource may capture an entire hierarchy of entity identification. It may
describe the host in the cloud and specific container or an application running
in the process.
Note, that some of the process identification information can be associated with telemetry automatically by the OpenTelemetry SDK.
Context Propagation
All of OpenTelemetry cross-cutting concerns, such as traces and metrics,
share an underlying Context mechanism for storing state and
accessing data across the lifespan of a distributed transaction.
See Context for more information.
Propagators
OpenTelemetry uses Propagators to serialize and deserialize cross-cutting concern values
such as Spans (usually only the SpanContext portion) and Baggage. Different Propagator types define the restrictions
imposed by a specific transport and bound to a data type.
The Propagators API currently defines one Propagator type:
TextMapPropagatorinjects values into and extracts values from carriers as text.
Collector
The OpenTelemetry collector is a set of components that can collect traces, metrics and eventually other telemetry data (e.g. logs) from processes instrumented by OpenTelemetry or other monitoring/tracing libraries (Jaeger, Prometheus, etc.), do aggregation and smart sampling, and export traces and metrics to one or more monitoring/tracing backends. The collector will allow to enrich and transform collected telemetry (e.g. add additional attributes or scrub personal information).
The OpenTelemetry collector has two primary modes of operation: Agent (a daemon running locally with the application) and Collector (a standalone running service).
Read more at OpenTelemetry Collector Long-term Vision.
Instrumentation Libraries
The inspiration of the project is to make every library and application observable out of the box by having them call OpenTelemetry API directly. However, many libraries will not have such integration, and as such there is a need for a separate library which would inject such calls, using mechanisms such as wrapping interfaces, subscribing to library-specific callbacks, or translating existing telemetry into the OpenTelemetry model.
A library that enables OpenTelemetry observability for another library is called an Instrumentation Library.
An instrumentation library should be named to follow any naming conventions of the instrumented library (e.g. ‘middleware’ for a web framework).
For instrumentation hosted in OpenTelemetry repositories, the recommendation is to prefix packages with “opentelemetry-instrumentation”, followed by the instrumented library name itself. Examples include:
- opentelemetry-instrumentation-flask (Python)
- @opentelemetry/instrumentation-grpc (Javascript)
Instrumentations libraries not hosted by OpenTelemetry should avoid potential naming collisions with OpenTelemetry-hosted packages. For example, they may prefix instrumentation package name with their company or project name:
- {company}-opentelemetry-instrumentation-{component} (Python)
- @{company}/opentelemetry-instrumentation-{component} (Javascript)
See Instrumentation Library for more information.
Feedback
Was this page helpful?
Thank you. Your feedback is appreciated!
Please let us know how we can improve this page. Your feedback is appreciated!