Cart Service
Estás viendo la versión en inglés de está página porque aún no ha sido traducida. ¿Te interesa ayudar? Mira en Contribuir.
This service maintains items placed in the shopping cart by users. It interacts with a Valkey caching service for fast access to shopping cart data.
Note OpenTelemetry for .NET uses the
System.Diagnostic.DiagnosticSourcelibrary as its API instead of the standard OpenTelemetry API for Traces and Metrics.Microsoft.Extensions.Logging.Abstractionslibrary is used for Logs.
Traces
Initializing Tracing
OpenTelemetry is configured in the .NET dependency injection container. The
AddOpenTelemetry() builder method is used to configure desired instrumentation
libraries, add exporters, and set other options. Configuration of the exporter
and resource attributes is performed through environment variables.
Action<ResourceBuilder> appResourceBuilder =
    resource => resource
        .AddContainerDetector()
        .AddHostDetector();

builder.Services.AddOpenTelemetry()
    .ConfigureResource(appResourceBuilder)
    .WithTracing(tracerBuilder => tracerBuilder
        .AddSource("OpenTelemetry.Demo.Cart")
        .AddRedisInstrumentation(
            options => options.SetVerboseDatabaseStatements = true)
        .AddAspNetCoreInstrumentation()
        .AddGrpcClientInstrumentation()
        .AddHttpClientInstrumentation()
        .AddOtlpExporter());
Add attributes to auto-instrumented spans
Within the execution of auto-instrumented code you can get current span (activity) from context.
var activity = Activity.Current;
Adding attributes (tags in .NET) to a span (activity) is accomplished using
SetTag on the activity object. In the AddItem function from
services/CartService.cs several attributes are added to the auto-instrumented
span.
activity?.SetTag("app.user.id", request.UserId);
activity?.SetTag("app.product.quantity", request.Item.Quantity);
activity?.SetTag("app.product.id", request.Item.ProductId);
Add span events
Adding span (activity) events is accomplished using AddEvent on the activity
object. In the GetCart function from services/CartService.cs a span event is
added.
activity?.AddEvent(new("Fetch cart"));
Metrics
Initializing Metrics
Similar to configuring OpenTelemetry Traces, the .NET dependency injection
container requires a call to AddOpenTelemetry(). This builder configures
desired instrumentation libraries, exporters, etc.
Action<ResourceBuilder> appResourceBuilder =
    resource => resource
        .AddContainerDetector()
        .AddHostDetector();

builder.Services.AddOpenTelemetry()
    .ConfigureResource(appResourceBuilder)
    .WithMetrics(meterBuilder => meterBuilder
        .AddMeter("OpenTelemetry.Demo.Cart")
        .AddProcessInstrumentation()
        .AddRuntimeInstrumentation()
        .AddAspNetCoreInstrumentation()
        .SetExemplarFilter(ExemplarFilterType.TraceBased)
        .AddOtlpExporter());
Exemplars
Exemplars are configured in the Cart service with trace-based exemplar filter, which enables the OpenTelemetry SDK to attach exemplars to metrics.
First it creates a CartActivitySource, Meter and two Histograms. The
histogram keeps track from the latency of the methods AddItem and GetCart,
as those are two important methods in the Cart service.
Those two methods are critical to the Cart service as users shouldn’t wait too long when adding an item to the cart, or when viewing their cart before moving to the checkout process.
private static readonly ActivitySource CartActivitySource = new("OpenTelemetry.Demo.Cart");
private static readonly Meter CartMeter = new Meter("OpenTelemetry.Demo.Cart");
private static readonly Histogram<long> addItemHistogram = CartMeter.CreateHistogram<long>(
    "app.cart.add_item.latency",
    advice: new InstrumentAdvice<long>
    {
        HistogramBucketBoundaries = [ 500000, 600000, 700000, 800000, 900000, 1000000, 1100000 ]
    });
private static readonly Histogram<long> getCartHistogram = CartMeter.CreateHistogram<long>(
    "app.cart.get_cart.latency",
    advice: new InstrumentAdvice<long>
    {
        HistogramBucketBoundaries = [ 300000, 400000, 500000, 600000, 700000, 800000, 900000 ]
    });
Note that a custom bucket boundary is also defined, as the default values don’t fit the microseconds results Cart service has.
Once the variables are defined, the latency of the execution of each method is
tracked with a StopWatch as follows:
var stopwatch = Stopwatch.StartNew();

(method logic)

addItemHistogram.Record(stopwatch.ElapsedTicks);
To connect it all together, in the Traces pipeline, it is required to add the created source. (Already present in the snippet above, but added here to reference):
.AddSource("OpenTelemetry.Demo.Cart")
And, in the Metrics pipeline, the Meter and the ExemplarFilter:
.AddMeter("OpenTelemetry.Demo.Cart")
.SetExemplarFilter(ExemplarFilterType.TraceBased)
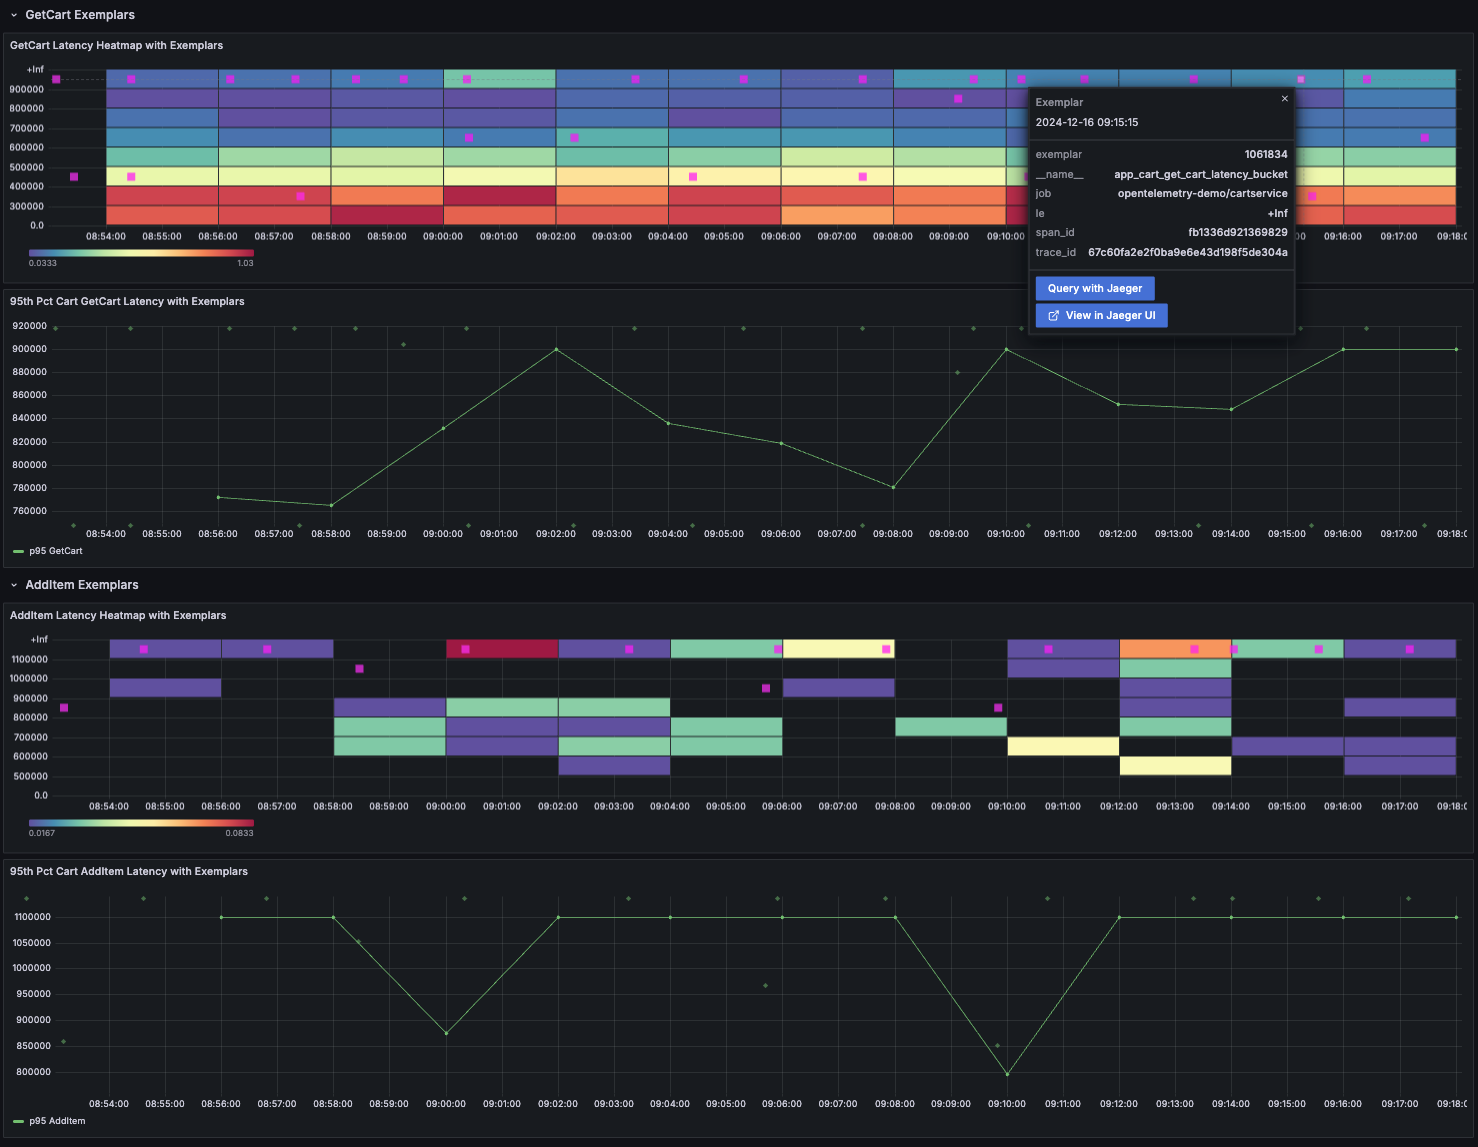
To visualize the Exemplars, navigate to Grafana http://localhost:8080/grafana > Dashboards > Demo > Cart Service Exemplars.
Exemplars appear as special “diamond-shaped dots” on the 95th percentile chart
or as small squares on the heatmap chart. Select any exemplar to view its data,
which includes the timestamp of the measurement, the raw value, and the trace
context at the time of recording. The trace_id enables navigation to the
tracing backend (Jaeger, in this case).

Logs
Logs are configured in the .NET dependency injection container on
LoggingBuilder level by calling AddOpenTelemetry(). This builder configures
desired options, exporters, etc.
builder.Logging
    .AddOpenTelemetry(options => options.AddOtlpExporter());
Comentarios
¿Fue útil esta página?
Thank you. Your feedback is appreciated!
Please let us know how we can improve this page. Your feedback is appreciated!