OpenTelemetry OpAMP を使ってサービスのテレメトリーを動的に変更する
Blog posts are not updated after publication. This post is more than a year old, so its content may be outdated, and some links may be invalid. Cross-verify any information before relying on it.
サービスのテレメトリーはどの程度詳細であるべきでしょうか。 サービスはすべてのトレース、メトリクス、ログを常に100%出力すべきでしょうか。 サービストラフィックのうち、どの程度をサンプリングすべきでしょうか。 この問いに対する答えは「場合による」だと考えます。 求められるテレメトリーデータは、開発から継続的デプロイに至るサービスライフサイクルの中で変化します。 クライアントがエラーに直面したときや、サービスが大規模にスケールされたときにも変化します。
サービスのテレメトリー設定やサンプリングレートを変更すること自体は可能です。 通常、最小限のコード変更とデプロイプロセスだけで済みます。 大した手間ではないように思えるかもしれませんが、システム全体にわたってこのような変更が必要になると、私たちはそれを避ける傾向があります。 かわりに、できるだけ多くのデータを収集するのが一般的ですが、それ自体が問題を引き起こします。 このような障壁なしに、サービスのテレメトリーを動的に変更することはできるのでしょうか。 OpAMP プロトコルとその開発に携わる人々のおかげで、答えは変わろうとしていると考えます。
OpAMP は Open Agent Management Protocol の略です。 大規模なデータ収集エージェントのフリートを管理することを目的としており、GoLang の実装はベータ段階にあります。 設定の変更やパッケージのダウンロードが可能です。 OpAMP サーバーと OpAMP クライアント間の通信を定義しますが、特定のクライアントとエージェントの関係を前提としないため、高い柔軟性を備えています。
以下の例では、シンプルな GoLang サーバーを作成して計装し、OpAMP サーバーとスーパーバイザーで制御します。 OpAMP の実装そのものには深入りせず、これらの例を使ってその活用方法に焦点を当てます。
まず、この基本的な Go サーバーを見てみましょう。
package main

import (
	"fmt"
	"log"
	"net/http"
)

func httpHandler(w http.ResponseWriter, r *http.Request) {
	fmt.Fprintf(w, "Hi! This action could create a trace!")
}

func main() {
	handler := http.HandlerFunc(httpHandler)
	http.Handle("/", handler)
	fmt.Println("Starting server on port 8080")
	log.Fatal(http.ListenAndServe(":8080", nil))
}
次に、effective.yaml という基本的な設定ファイルを追加します。
main.go ファイルと同じフォルダに、以下の設定で配置してください。
instrument: false
サーバーに基本的な設定ハンドラを追加しましょう。
package main

import (
   "fmt"
   "gopkg.in/yaml.v3"
   "io/ioutil"
   "log"
   "net/http"
   "path/filepath"
)

type configurations struct {
   Instrument bool
}

func httpHandler(w http.ResponseWriter, r *http.Request) {
   fmt.Fprintf(w, "Hi! This action could create a trace!")
}

func main() {
   filename, _ := filepath.Abs("./effective.yaml")
   yamlFile, _ := ioutil.ReadFile(filename)

   var config configurations
   yaml.Unmarshal(yamlFile, &config)

   handler := http.HandlerFunc(httpHandler)
   http.Handle("/", handler)
   fmt.Println("Starting server on port 8080")
   log.Fatal(http.ListenAndServe(":8080", nil))
}
次に、ハンドラを計装でラップし、設定ファイルに基づいて計装の有無を切り替えましょう。 以下のようになります。
package main

import (
   "context"
   "fmt"
   "go.opentelemetry.io/contrib/instrumentation/net/http/otelhttp"
   "go.opentelemetry.io/otel"
   "go.opentelemetry.io/otel/exporters/stdout/stdouttrace"
   sdktrace "go.opentelemetry.io/otel/sdk/trace"
   "go.opentelemetry.io/otel/trace"
   "gopkg.in/yaml.v3"
   "io/ioutil"
   "log"
   "net/http"
   "os"
   "path/filepath"
)

type configurations struct {
   Instrument bool
}

var tracer trace.Tracer

func newConsoleExporter() (sdktrace.SpanExporter, error) {
   return stdouttrace.New(
      stdouttrace.WithWriter(os.Stdout),
      stdouttrace.WithPrettyPrint(),
   )
}

func httpHandler(w http.ResponseWriter, r *http.Request) {
   fmt.Fprintf(w, "Hi! This action could create a trace!")
}

func setHandler(handler http.Handler, config configurations) http.Handler {
   if config.Instrument {
      return otelhttp.NewHandler(handler, "instrumentation activated by OpAMP")
   }
   return http.HandlerFunc(httpHandler)
}

func main() {
   filename, _ := filepath.Abs("./effective.yaml")
   yamlFile, _ := ioutil.ReadFile(filename)

   var config configurations
   yaml.Unmarshal(yamlFile, &config)

   exp, _ := newConsoleExporter()
   tp := sdktrace.NewTracerProvider(sdktrace.WithBatcher(exp))
   defer func() { _ = tp.Shutdown(context.Background()) }()

   otel.SetTracerProvider(tp)

   tracer = tp.Tracer("ControlledOpAMPAgentDemo")
   handler := http.HandlerFunc(httpHandler)
   http.Handle("/", setHandler(handler, config))
   fmt.Println("Starting server on port 8080")
   log.Fatal(http.ListenAndServe(":8080", nil))
}
このアプリをビルドして実行します。
go build .
go run .
ブラウザを開いて http://localhost:8080 にアクセスしてください。 特に変わったものは表示されません。 ここで OpAMP を追加しましょう。 opamp-go を Git clone し、以下のコマンドでサーバーを起動します。
cd internal/examples/server
go run .
http://localhost:4321 にアクセスして、サーバーが起動していることを確認してください。 エージェントが表示されていないことに注目してください。
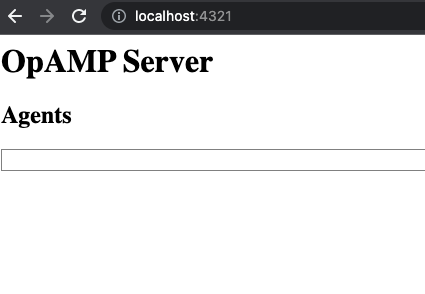
次に、internal/examples/supervisor/bin/supervisor.yaml を編集して、先ほどのエージェントを指すようにします。 以下のようになるはずです。
server:
  endpoint: ws://127.0.0.1:4320/v1/opamp
agent:
  executable: <absolute|relative path to previous build>
新しいターミナルを開き、以下のコマンドを実行します。
cd internal/examples/supervisor/bin
go build -o ./supervisor ../main.go
./supervisor
これで、OpAMP サーバー、スーパーバイザー、そして先ほどのサーバーで構成されるシステムができました。
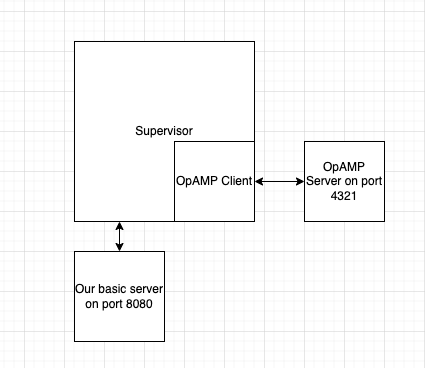
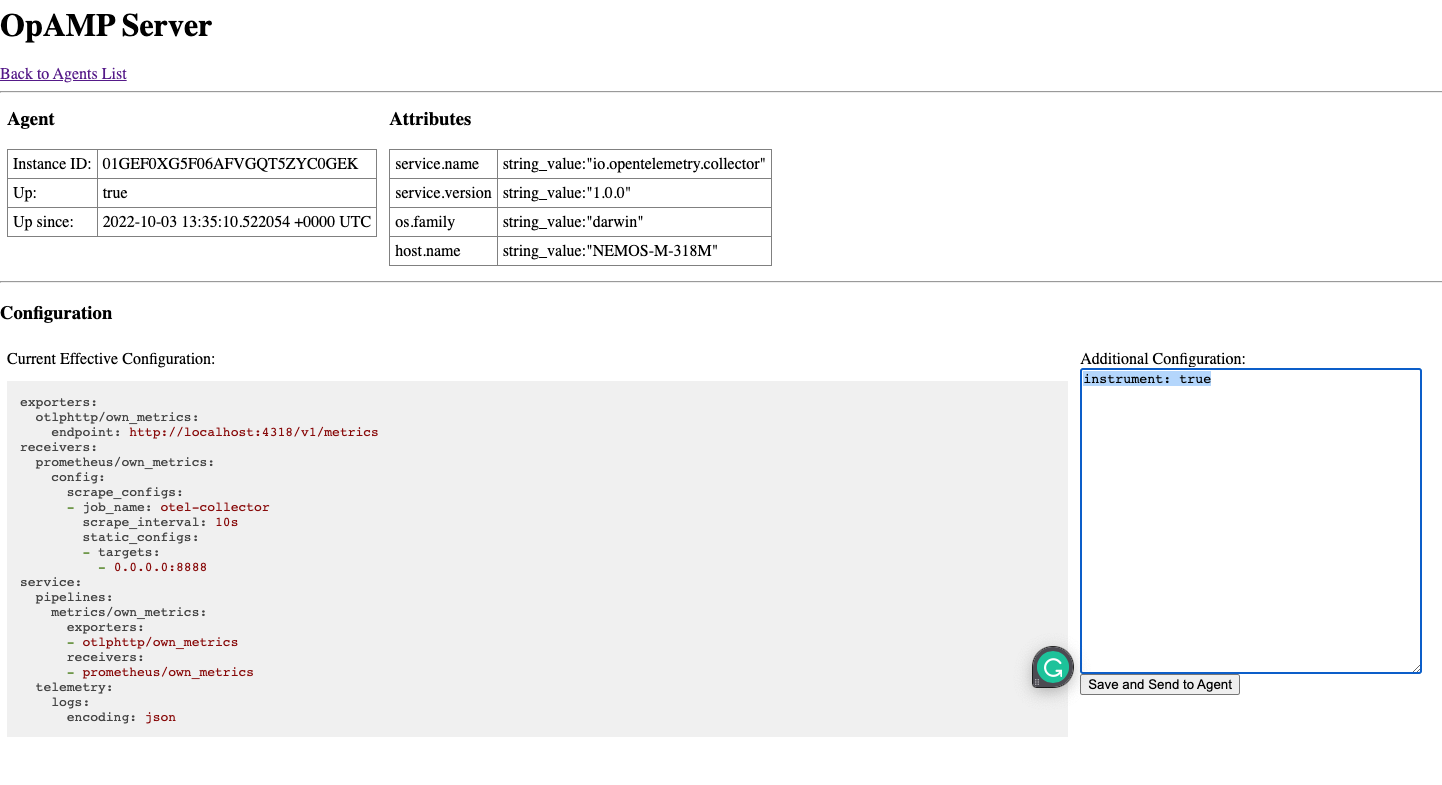
スーパーバイザーを介して、http://localhost:4321 でエージェントが動作しているのを確認できます。
エージェントを選択し、設定に instrument: true を渡してください。
スーパーバイザーのコンソールログで変更を確認できます。
Received remote config from server, hash=0008886301f3ccb3520216823cfa09a.
Effective config changed.
Config is changed. Signal to restart the agent.
Restarting the agent with the new config.
Stopping agent process, PID=19206
Agent process PID=19206 successfully stopped.
Starting agent <agent path>
Agent process started, PID=19506
最後に、http://localhost:8080 にアクセスしてください。
internal/examples/supervisor/bin/agent.log にトレースが表示されるはずです。
Starting server on port 8080
{
   "Name": "instrumentation activated by OpAMP server",
   "SpanContext": {
      "TraceID": "d2f76958023624d4c1def3f44899b6d4",
      "SpanID": "085510f551dc31a1",
      "TraceFlags": "01",
      "TraceState": "",
      "Remote":false
   ...
これらの行がトレースそのものです!
まとめると、ここではサービスがトレースを生成するかどうかを制御するサーバーを構築しました。
instrument: false の設定を使って、計装をオフにすることも試してみてください。
これは非常に基本的な実装です。 OpAMP の上にシステムをラップすれば、計装オーケストレーターとして機能させることができます。 出発点は、システムに合わせたカスタムの動的テレメトリーを外部から追加・適用できるようになることです。 AI がこの種のシステムで何を実現できるか想像してみてください。 システム全体のメトリクスを収集し、検出されたボトルネックにトレースやログの収集を自動的かつ動的に追加できるでしょう。 このプロトコルを使うことで、多くの新しい可能性が開かれます。 テレメトリーに対する考え方を変える可能性を持っていると信じています。