Configure OBI
Learn how to configure OBI.
Ви переглядаєте англійську версію сторінки, тому що її ще не було повністю перекладеною українською. Бажаєте допомогти? Дивіться як взяти Участь.
PS. Неофіційний український переклад (не перевірений і не ухвалений OpenTelemetry) доступний на сайті члена спільноти, створеному на основі PR #5891. Ми надаємо це посилання як тимчасовий захід підтримки українських читачів та потенційних учасників, доки не буде готовий офіційний переклад.
OpenTelemetry libraries provide telemetry collection for popular programming languages and frameworks. However, getting started with distributed tracing can be complex. In some compiled languages like Go or Rust, you must manually add tracepoints to the code.
OpenTelemetry eBPF Instrumentation (OBI) is an auto-instrumentation tool to easily get started with Application Observability. OBI uses eBPF to automatically inspect application executables and the OS networking layer, and capture trace spans, Rate Errors Duration (RED) metrics, runtime metrics, and application and network relationships for supported Linux workloads. All data capture occurs without any modifications to application code or configuration.
OBI offers the following features:
OBI v0.12.1 is the published release of the changes prepared for v0.12.0. Although v0.12.0 was tagged, it was not published after release validation failed. Install v0.12.1, which includes the intended v0.12.0 changes and the release correction.
Notable changes include:
@opentelemetry/api
when the application has not registered an OpenTelemetry SDKOTEL_CTX mappingdb.server.operation.duration for
server-side Redis, Memcached, and SQL operationsjavaFor a complete list of changes and upgrade notes, see the release notes.
If you want to explore the upstream examples, see the NGINX walkthrough and the Apache walkthrough.
The following diagram shows the high-level OBI architecture and where eBPF instrumentation fits into the telemetry pipeline.
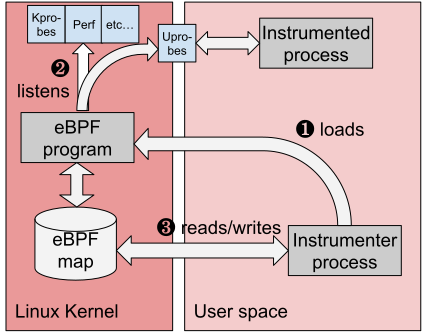
OBI supports Linux environments that meet the following requirements:
| Requirement | Supported |
|---|---|
| CPU architecture | amd64, arm64 |
| Linux kernel | 5.8+, or RHEL-family Linux 4.18+ with the required eBPF backports |
| Kernel features | BTF |
| Privileges | Root, or the Linux capabilities required by the enabled OBI features |
OBI publishes the following supported release artifacts:
| Artifact | Supported platforms |
|---|---|
obi binary archive | Linux amd64, Linux arm64 |
otel/ebpf-instrument container image | Linux amd64, Linux arm64 |
otel/opentelemetry-ebpf-k8s-cache container image | Linux amd64, Linux arm64 |
OBI can be deployed on standalone Linux hosts, in containers, and on Kubernetes when the environment meets the requirements above.
OBI does not support non-Linux operating systems, Linux architectures other than
amd64 and arm64, Linux environments without BTF, or kernel versions earlier
than Linux 5.8 outside the documented RHEL-family 4.18+ exception.
Feature-specific support details are documented in these guides:
OBI provides application and protocol observability without code changes, but it does not replace language-level instrumentation in every scenario. Use language agents or manual instrumentation when you need custom spans, application-specific attributes, business events, or other in-process telemetry that eBPF-based instrumentation cannot derive automatically.
OBI can automatically capture network and protocol activity, but it cannot always recover application-specific details that are not visible from eBPF observation points.
Some features also have additional caveats or narrower support than the core platform requirements. For details, refer to the feature-specific documentation for distributed traces and exported instrumentation.
For a comprehensive list of capabilities required by OBI, refer to Security, permissions and capabilities.
Learn how to configure OBI.
Configuring OBI to observe point-to-point network metrics.
Learn how to set up and run OBI.
Learn about the application, runtime, and network metrics OBI can export.
Learn about OBI’s distributed traces support.
How to measure total request times from the point of view of the client
Privileges and capabilities required by OBI
Troubleshooting OBI common issues and errors
Compatibility notes when running OBI alongside Cilium
Learn how OBI associates outgoing requests with incoming parent requests for distributed traces.
Overview of how to calculate the cardinality of metrics produced by a default OBI installation, considering the size and complexity of the instrumented environment.
Learn how OBI correlates application logs with distributed traces for faster debugging and troubleshooting.
Чи була ця сторінка корисною?
Thank you. Your feedback is appreciated!
Please let us know how we can improve this page. Your feedback is appreciated!